Economic Updates for April 2025
Summary
Tariffs, Turbulence, and a Turning Point: Rethinking Globalization and U.S. Growth
The markets have been very volatile lately and have become directionless. The price action is not indicating the future direction of the economy. So also the macroeconomic indicators are of no use as the tariff policy changes may make an immense impact on the macro data in the coming months.
The President has shown the world a master class in "The Art of the Deal". Perhaps we have put maximum uncertainty behind with the reprieve of 90 days to negotiate tariff levels with all countries except China. It is clear that we will look back at this period as the time when globalization peaked. This means the bilateral trades with other countries is likely to shrink. This is also likely to raise the cost of goods for the consumers. A similar period in history would be 100 years ago, in early 1930's when the Smoot-Hawley Act was passed to tariff imports as a way to stimulate local production. At that time, it was perceived as a failure especially since this was done during a time of deflation when consumer demand was waning and capital expenditures were dismal.
On the brighter side, this clears out the way for US to renovate old infrastructure, build state of the art industries in goods production and bring more domestic consumers into the market. This may invigorate the domestic consumption and let us hope that this will lead to a GDP growth higher than before.
The challenge ahead is to sort out the which industries will be impacted more than others and how the cost increase maybe absorbed between consumers, suppliers and the home country of the supplier.
During these turbulent times when the standard macro indicators have become impotent, we are very glad to partner with Awasthi Capital. Their quantitative macro models and leading indicators provide the necessary guidance for us to keep us focused on what lies ahead.
Awasthi Capital Macro Models
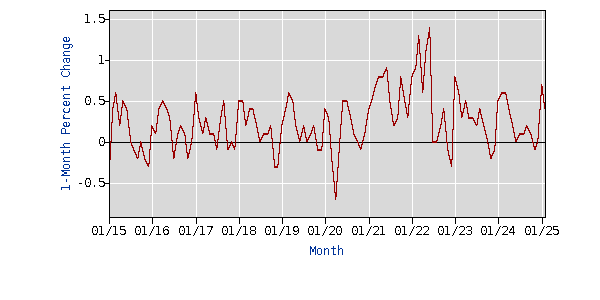
S&P Sentiment Model
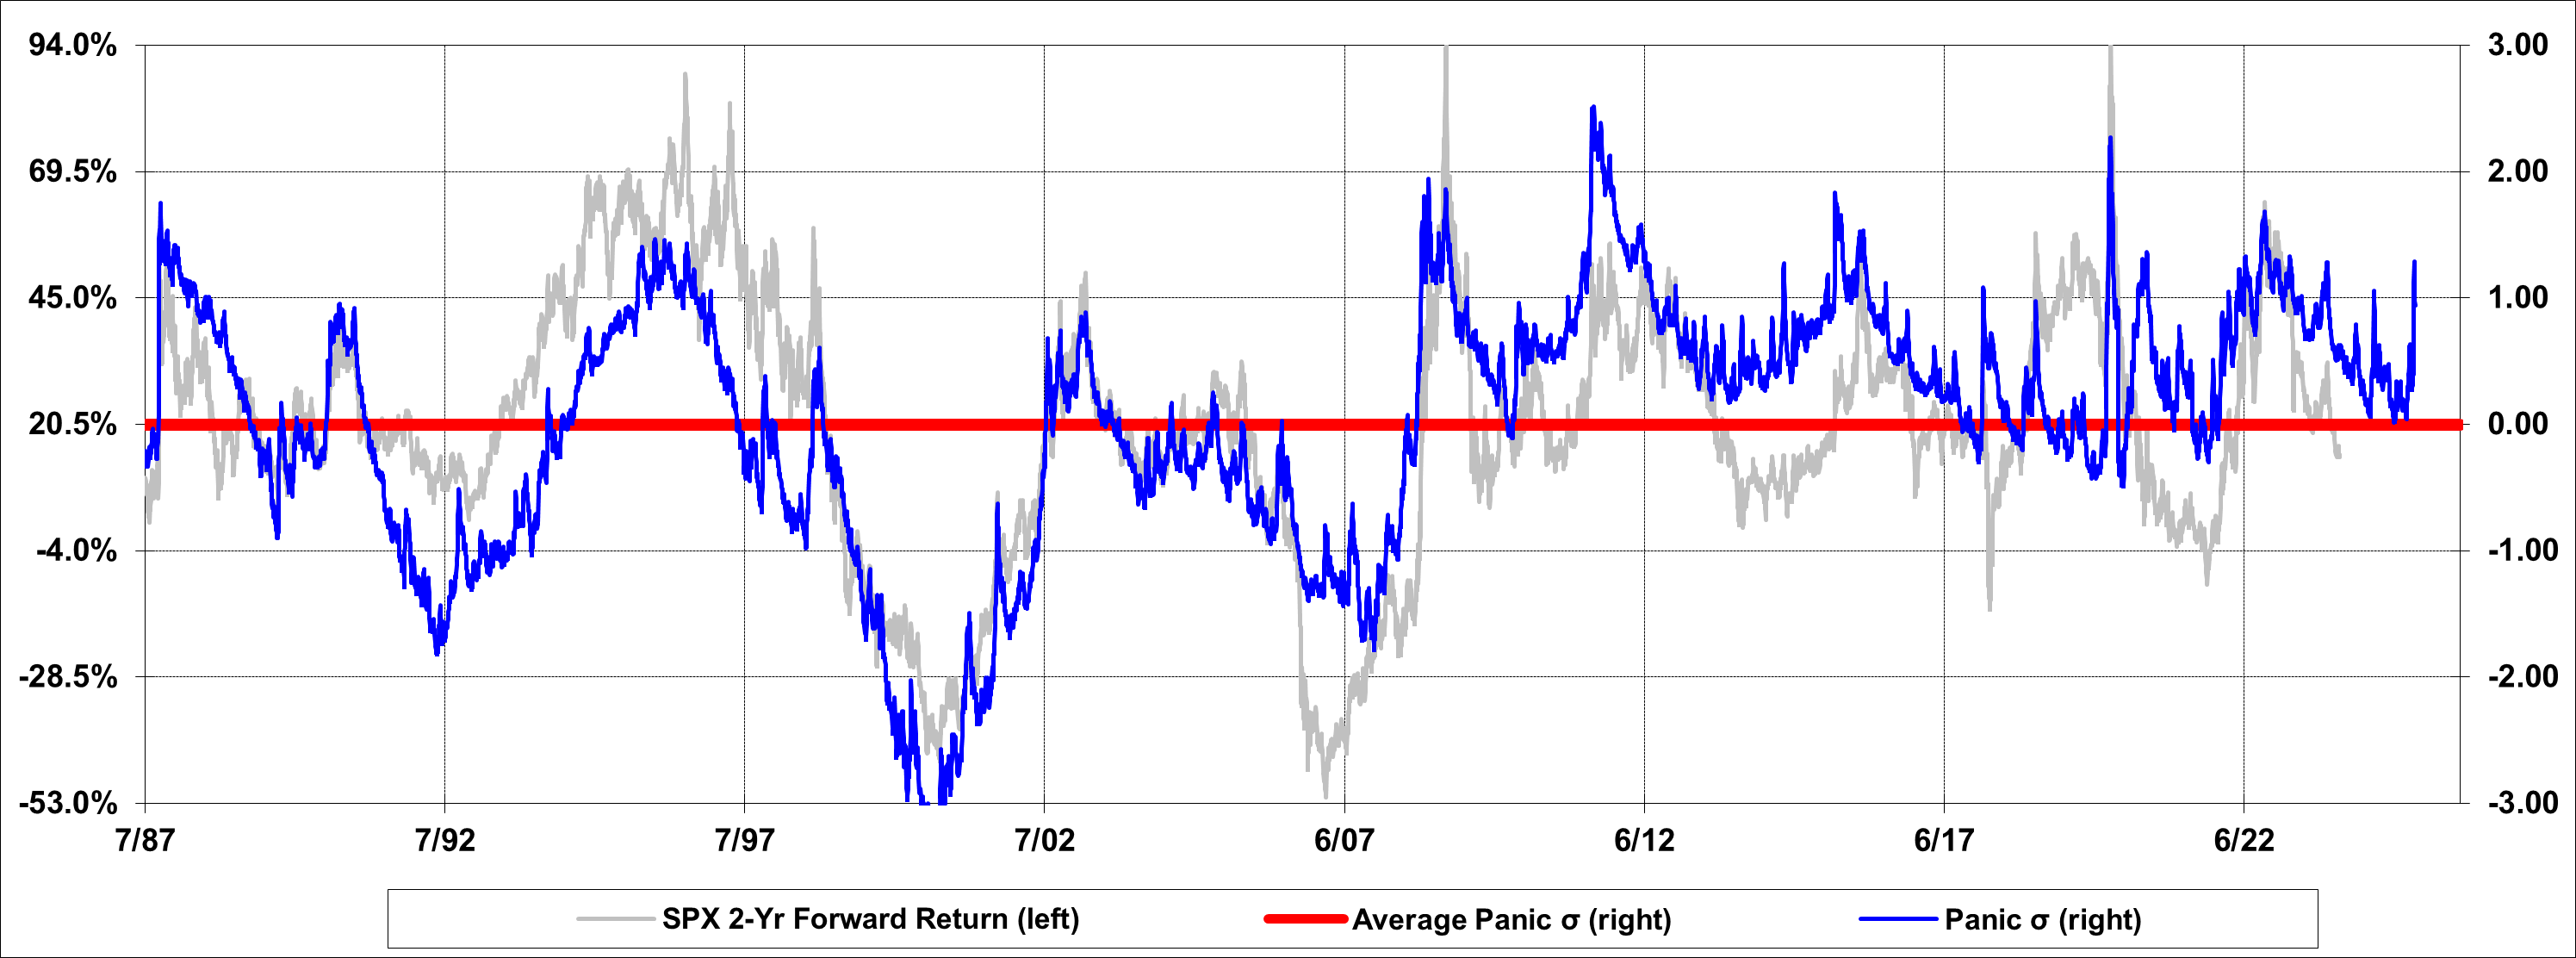
The Sentiment Model from Awasthi Capital is a leading indicator for S&P 500 returns 2 years from now. When the sentiment indicator is postive (indicating panic), two year forward S&P 500 returns are positive and vice versa.
A month ago, the sentiment model was transitioning over to euphoria. With the tariff talks and reciprocal tariff announcements and ensuing market volatility has pulled the sentiment model back into panic.Notes:
- Positive Panic in standard deviations measures above average investor panic. It can also be explained as below average risk preference.
- Negative Panic in standard deviations measures below average investor panic or above average investor euphoria. It can also be explained as above average risk preference.
- Investor panic approached the zero dividing line between panic and euphoria early this year but bounced to 1.3 standard deviations panic after the recent market decline.
S&P Valuation Model
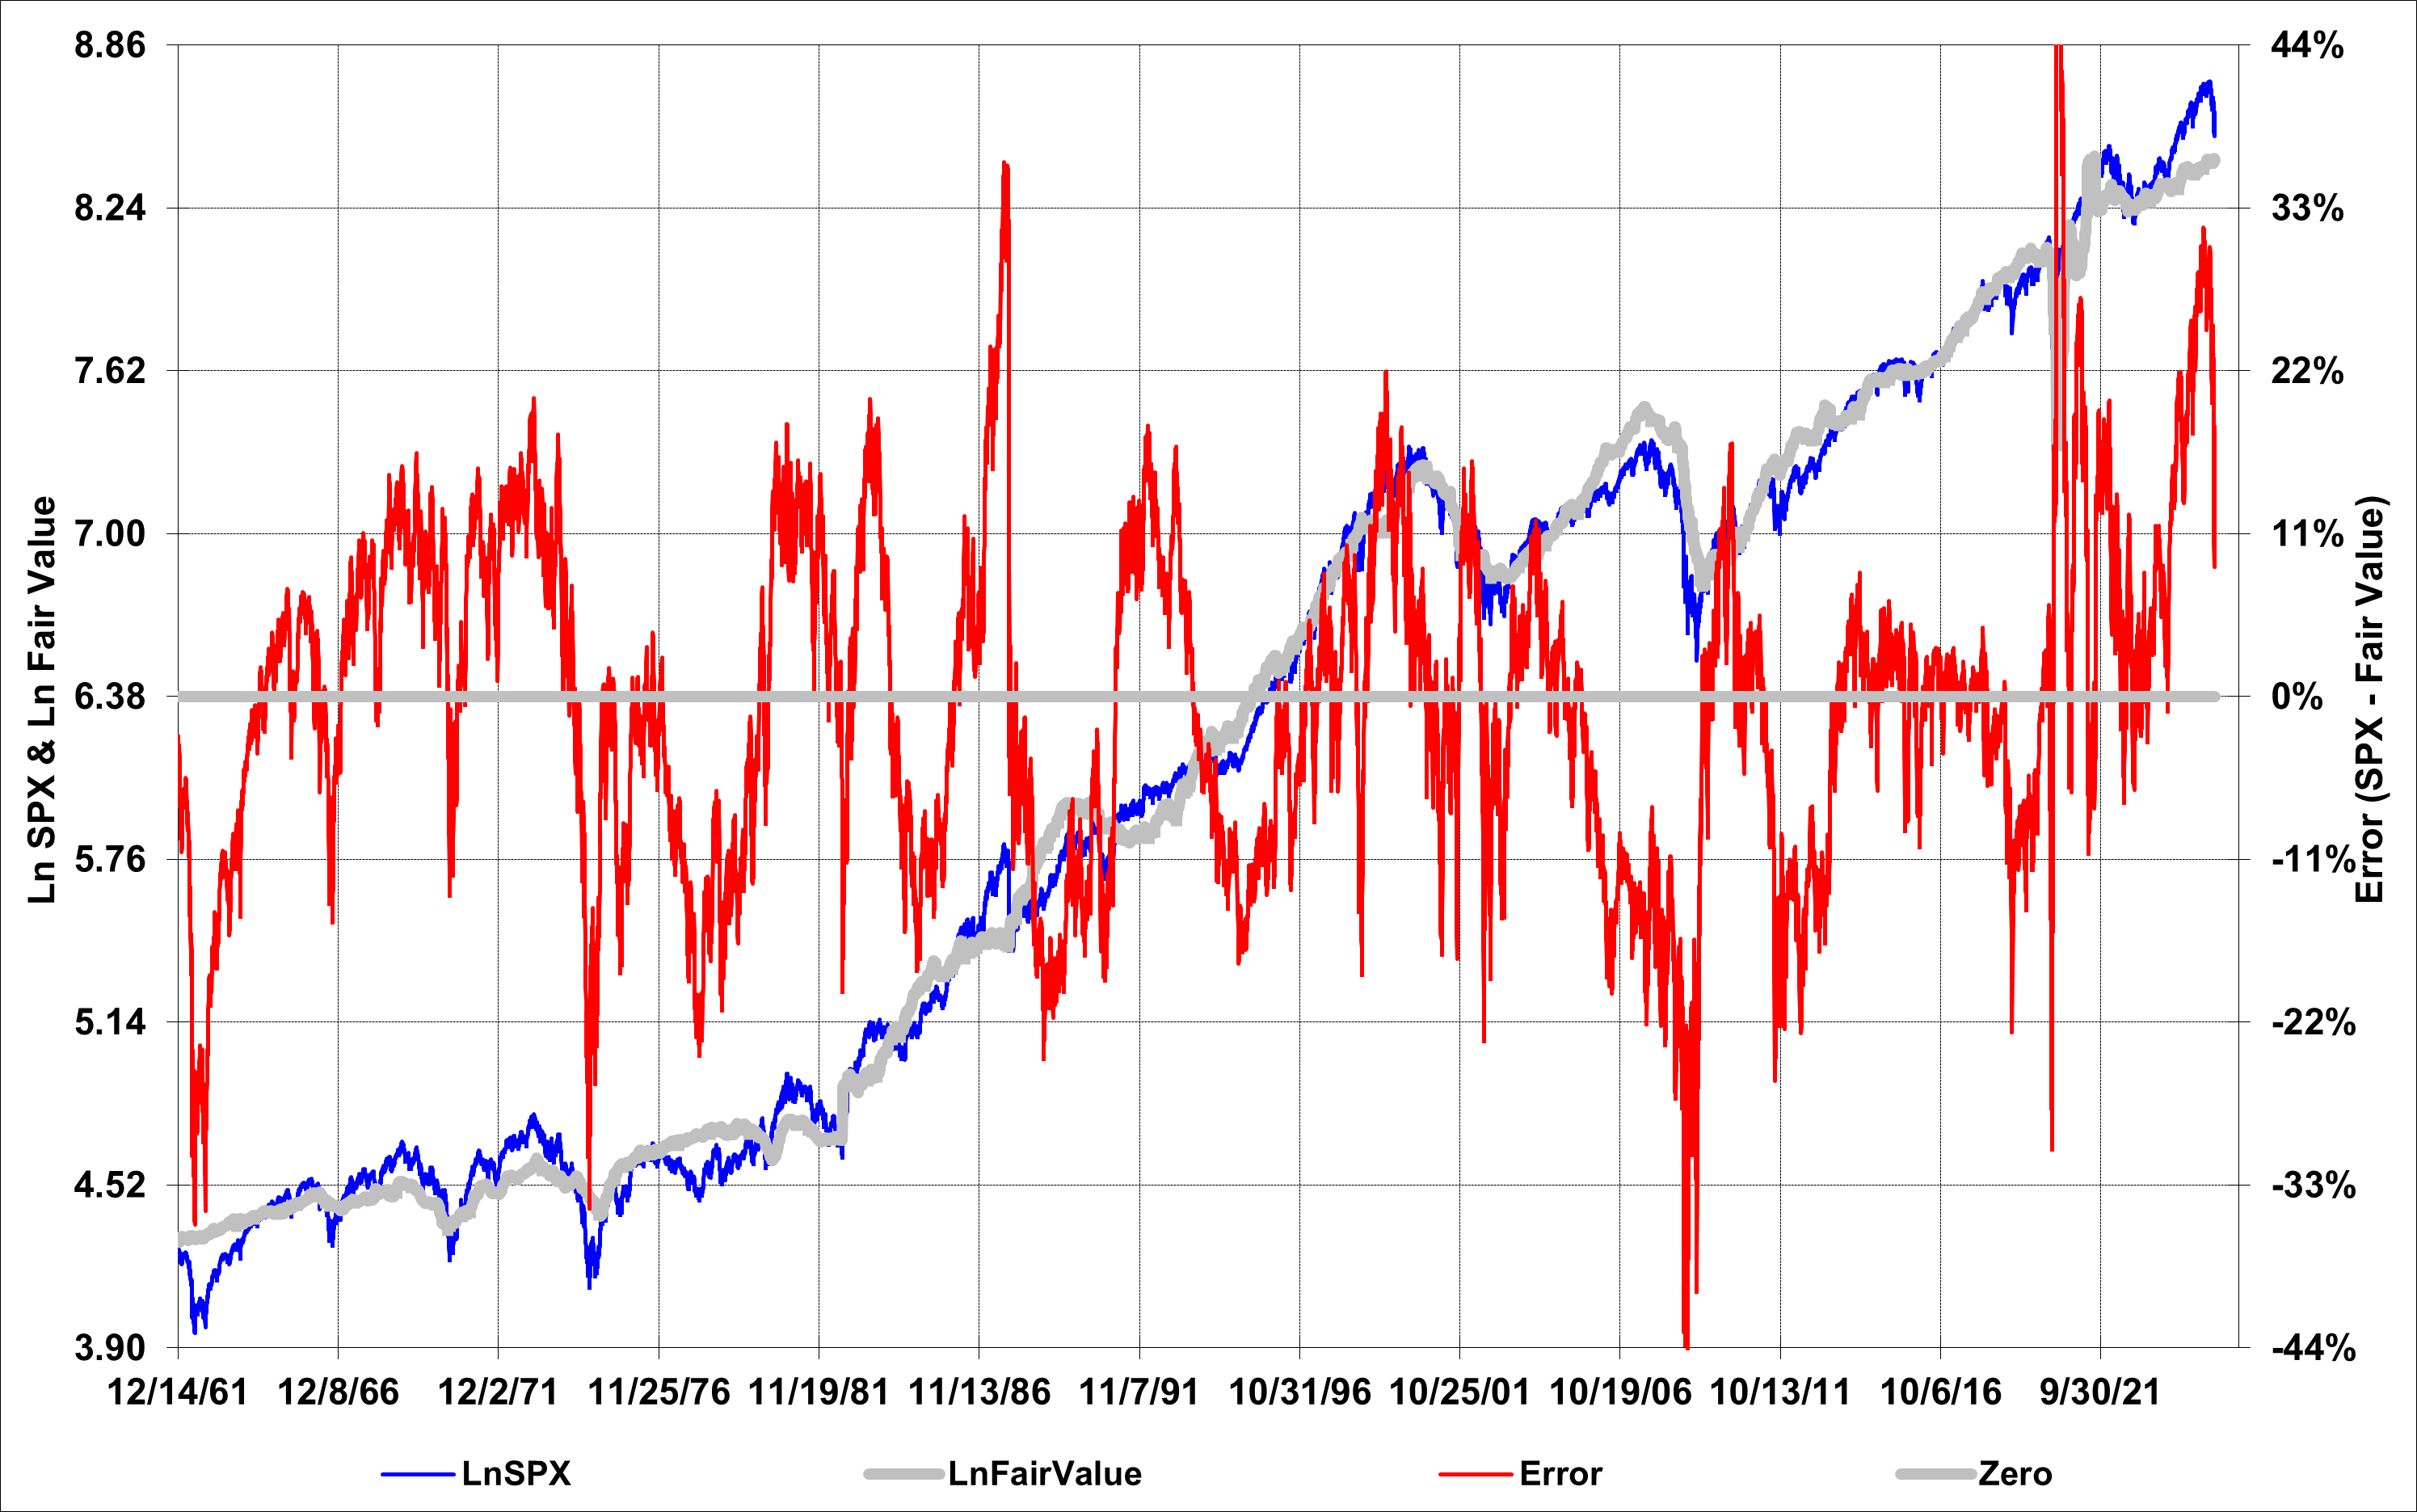
The Valuation Model from Awasthi Capital is a coincidental indicator S&P valuation. It provides a fair value of S&P 500 in relation to the current price indicating whether S&P 500 is over or undervalued.
As you can see, the valuation model currently indicates that S&P 500 is still overvalued after the recent sell off.Notes:
- The Fair Value Estimate is computed by Awasthi Capital's long-term top-down macro-economic quantitative models.
- The Error term is the difference between the Ln S&P 500 Index and Ln Fair Value Estimate. The Fair Value Estimate is computed by Awasthi Capital's long-term model.
Broad Indicators
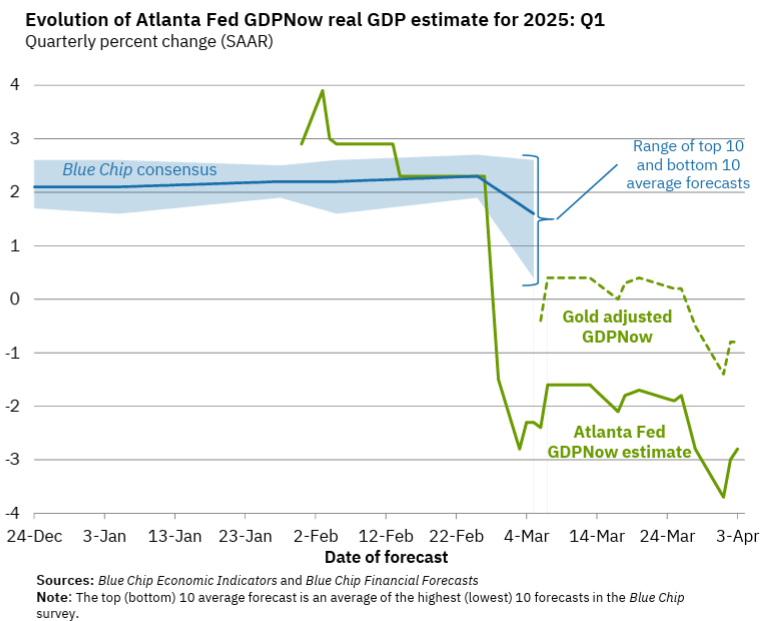
Atlanta GDP NowCast
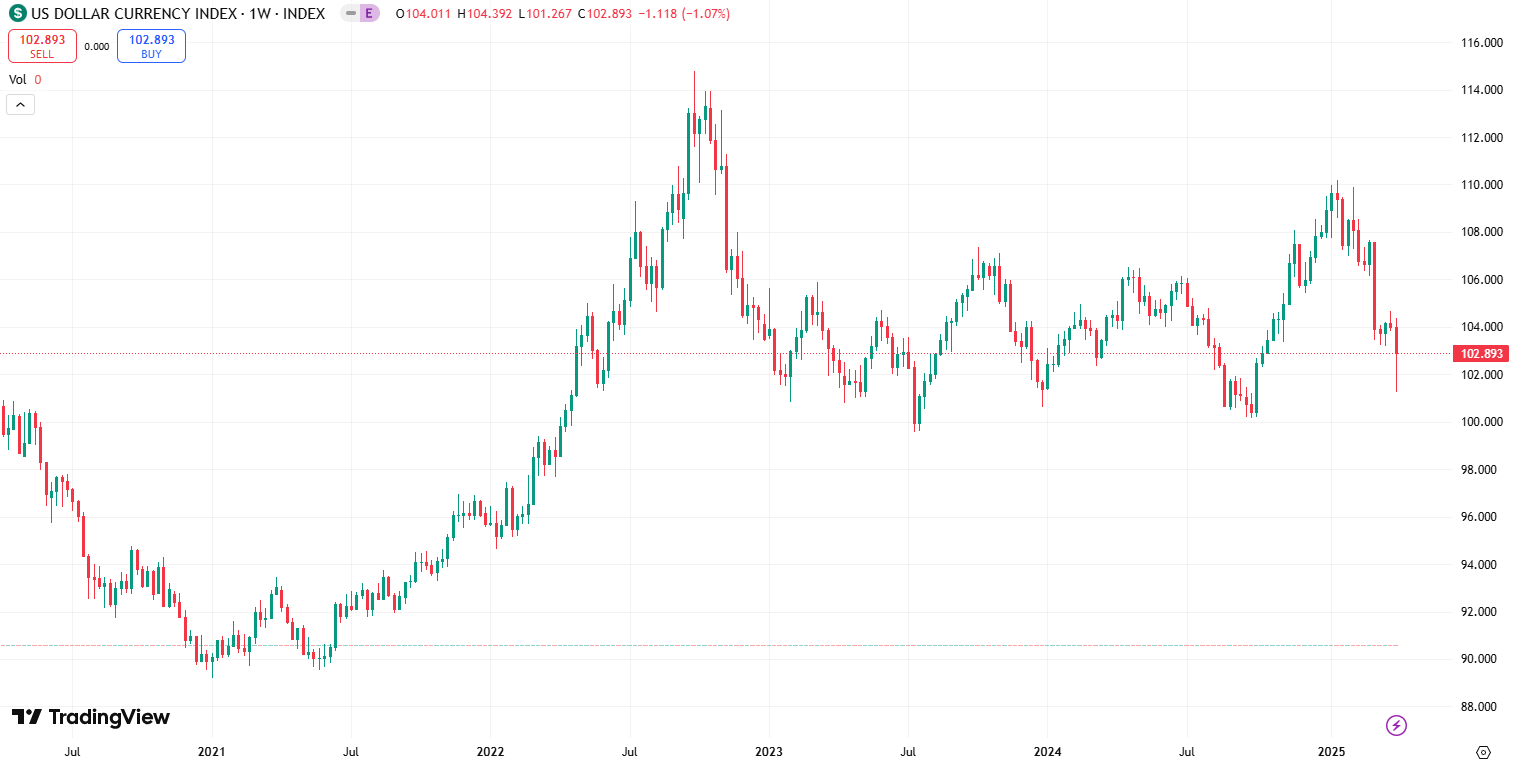
US Dollar Index
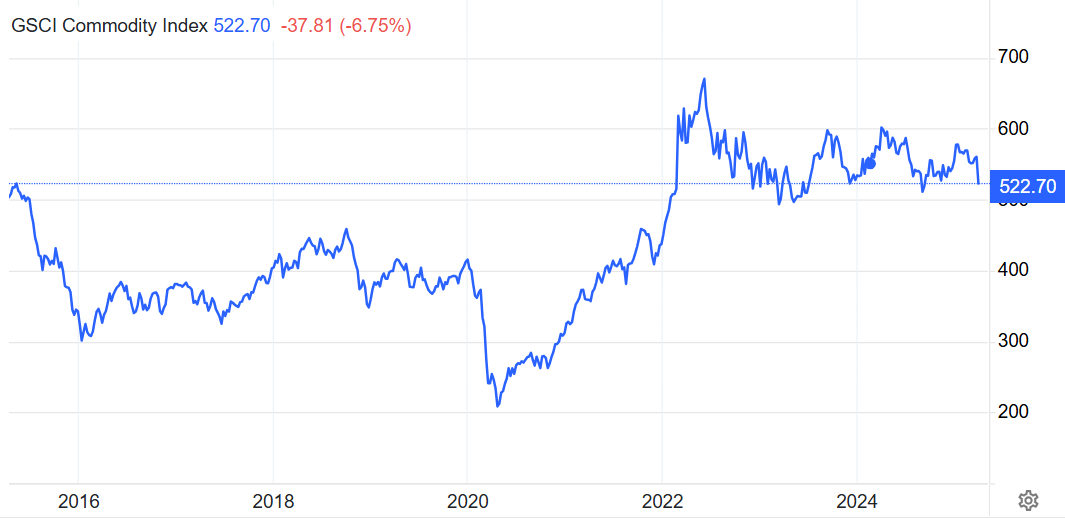
Commodities
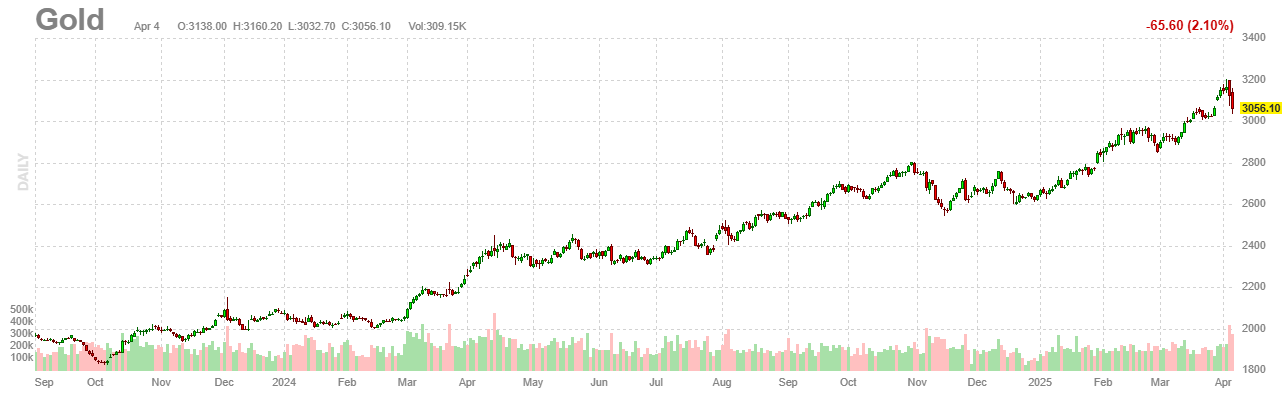
Gold
While Gold continued to perform very well as the USD may see higher volatility with the shake up in global trade, after the reciprocal tariff, we are noticing some weakness in gold as well. Potentially, traders are using Gold to raise cash for their margin unwinds.
Bitcoin
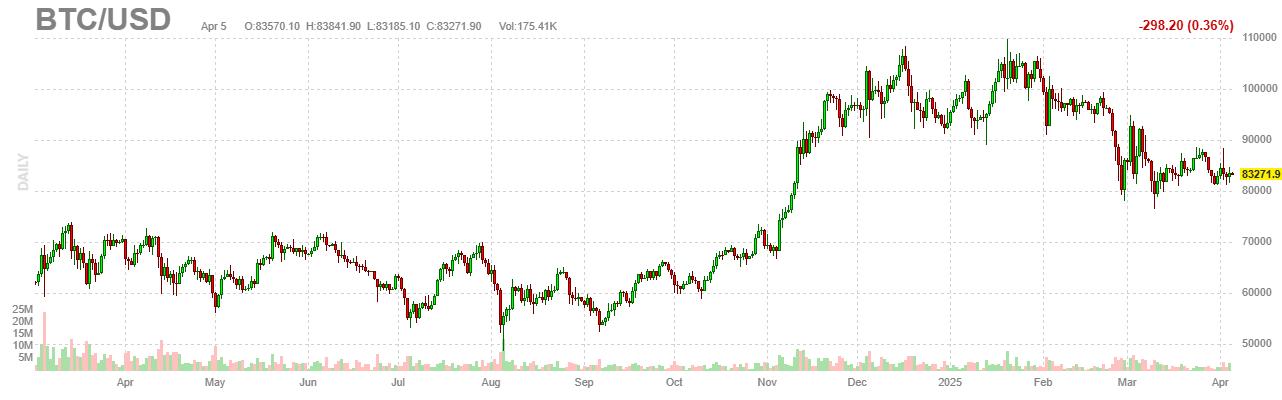
BitCoin continues to behave like a risk asset such as tech stocks.
Inflation
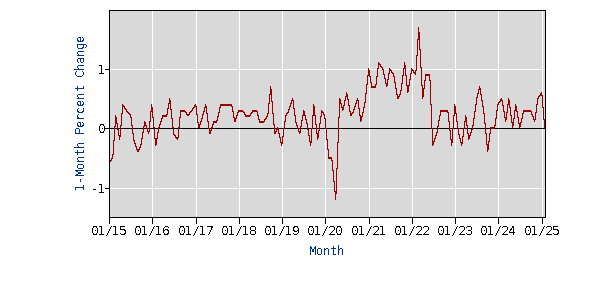
CPI Month over Month
PPI Month over Month
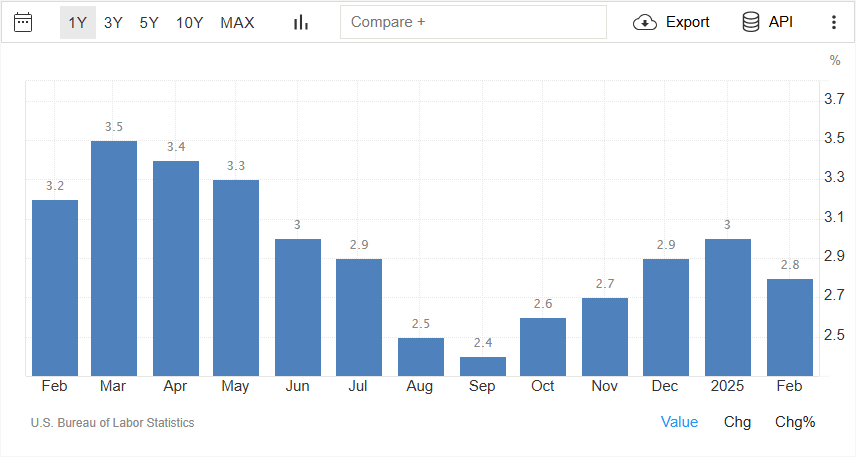
Reported Year over Year Inflation Rate
CPI Components
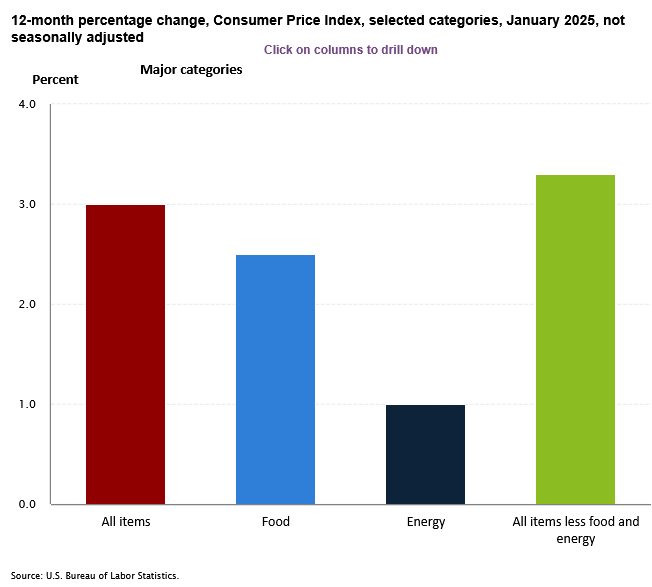 CPI Components Last Month
Source BLS.gov Consumer Price Index
CPI Components Last Month
Source BLS.gov Consumer Price Index
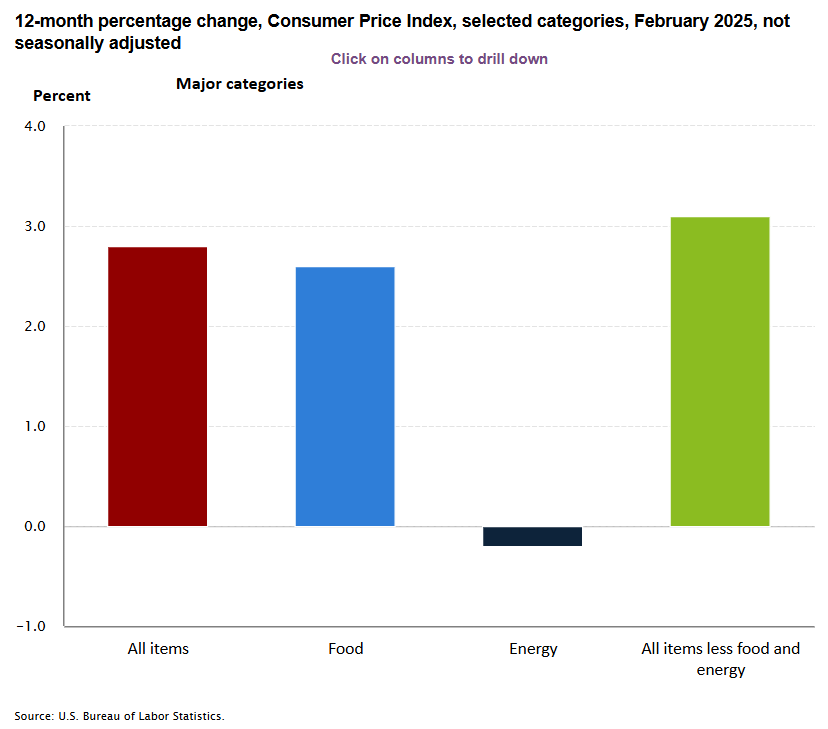 CPI Components This Month
The contributors to the inflation have been mainly food and transportation. (Please note that the y-axis in both the graphs have different scales).
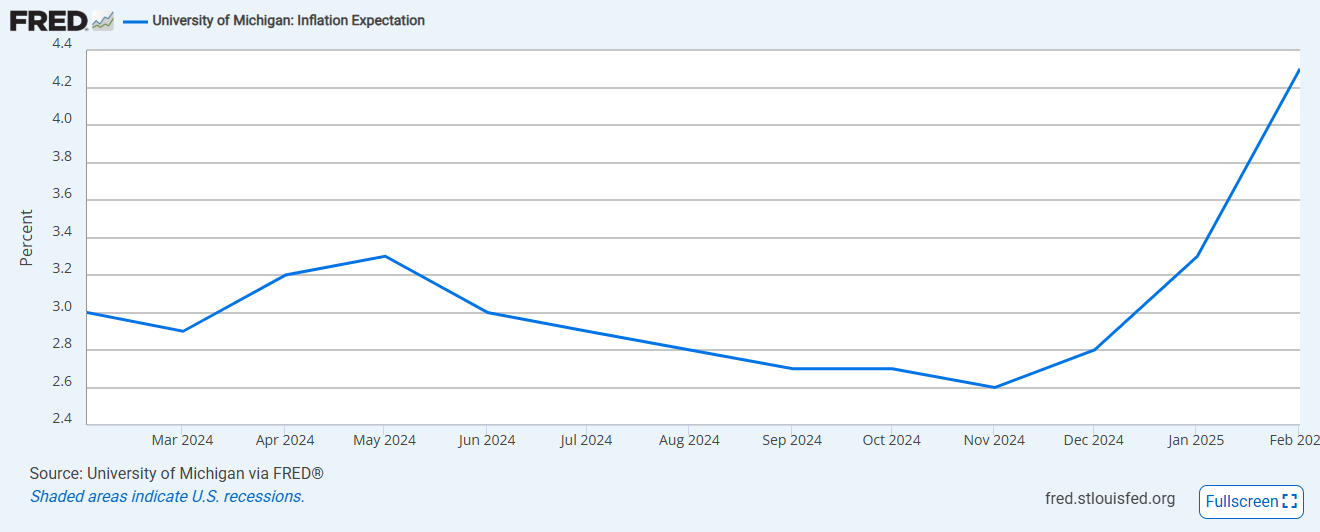
One Year Inflation Expectations
Sentiments
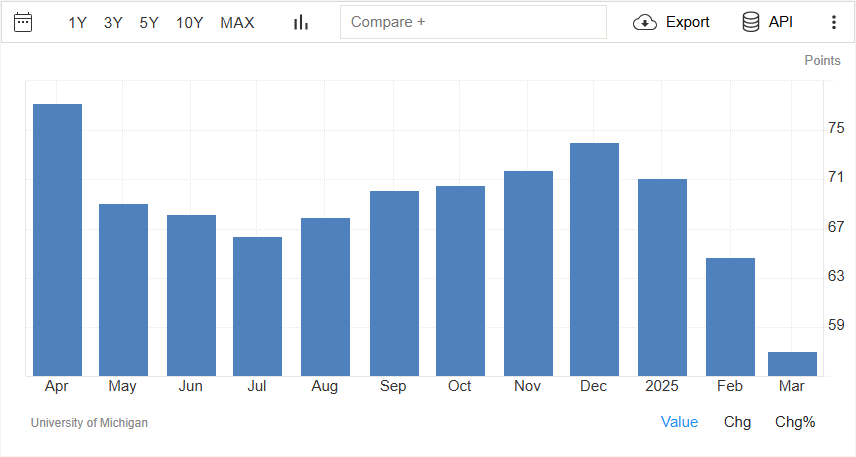
Consumer Sentiments
Investor Sentiments
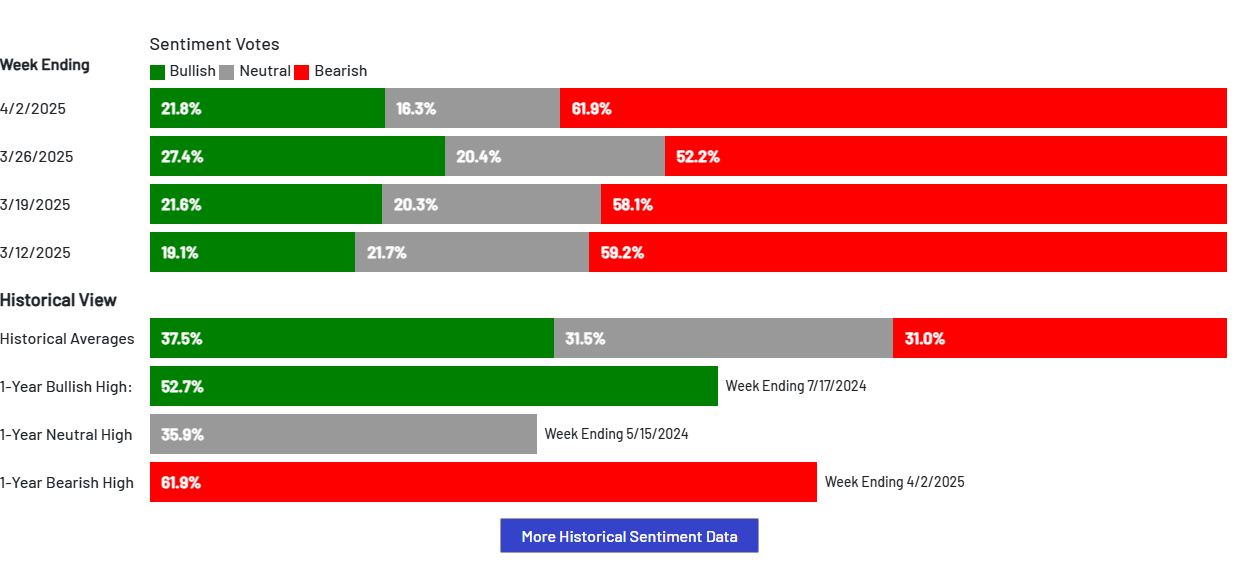
The AAII sentiment has been turning bearish over the last few weeks and is at 1 year bearish high!
GDP Factors
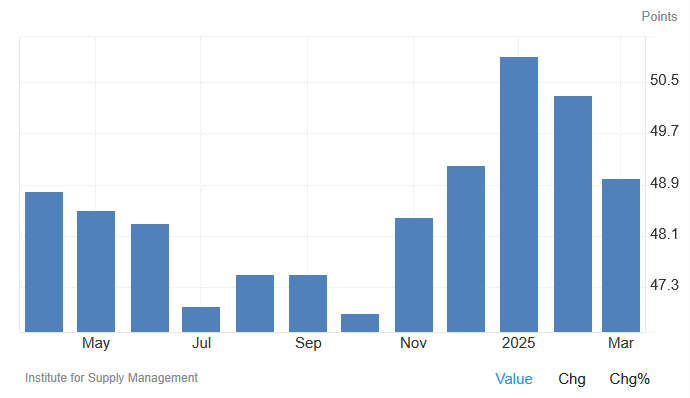
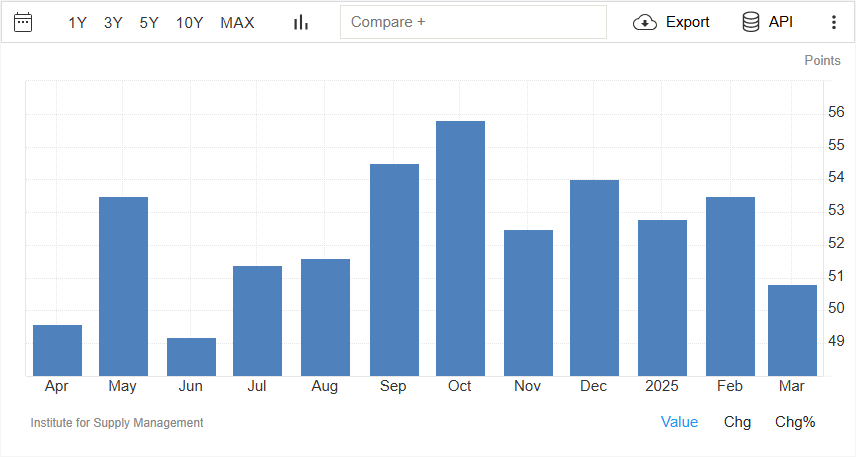
Manufacturing PMI
Services PMI
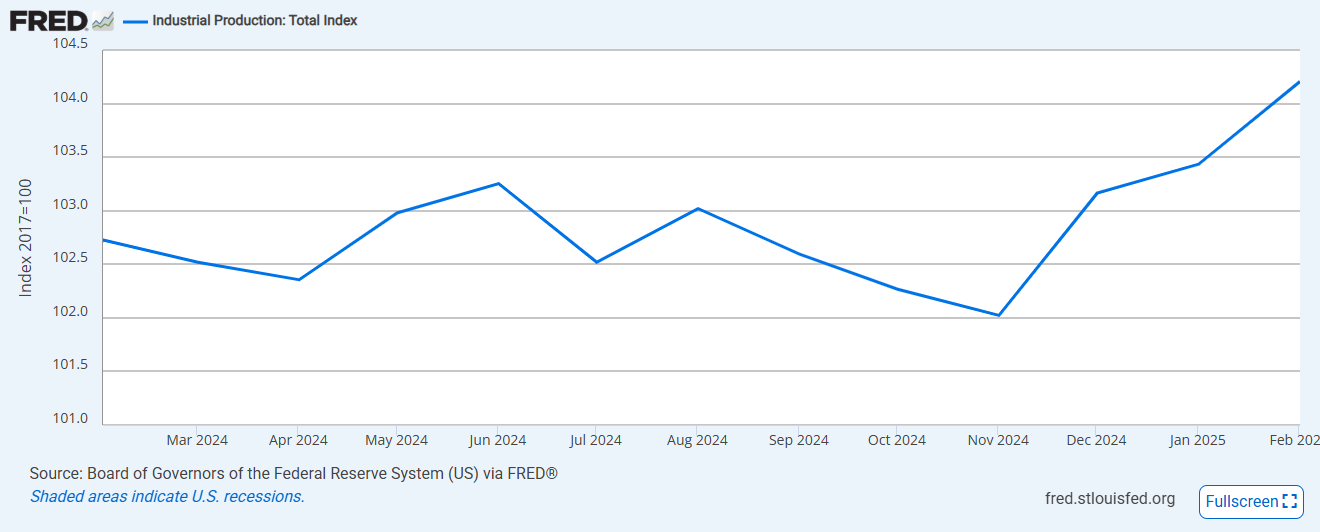
Industrial Production
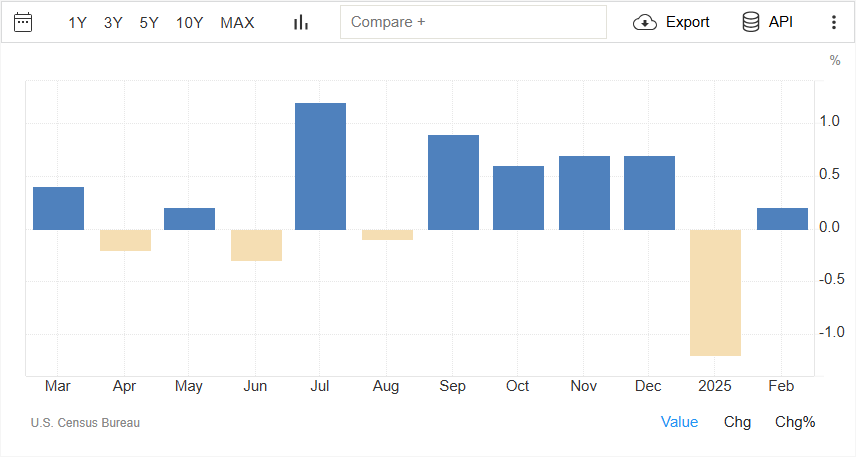
Retail Sales
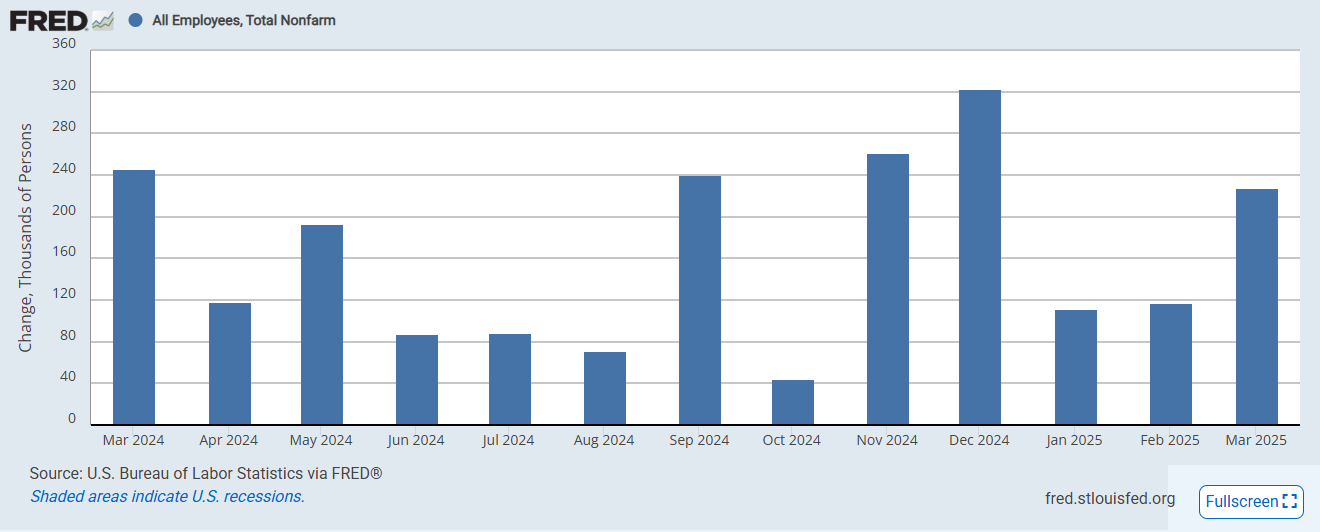
Non-farm Payrolls
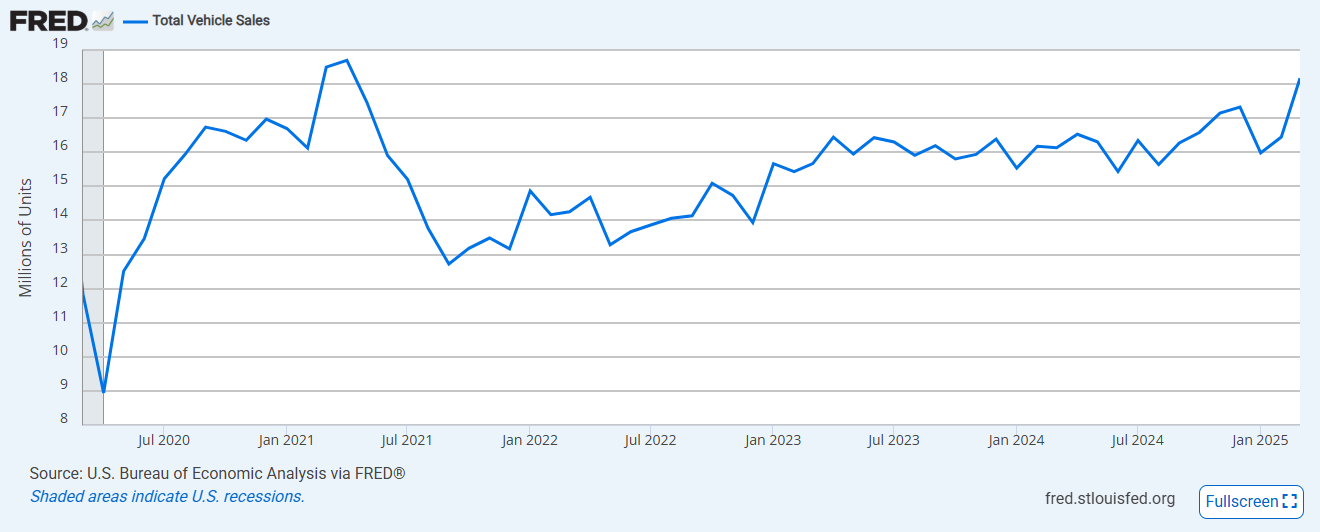
Total Vehicle Sales
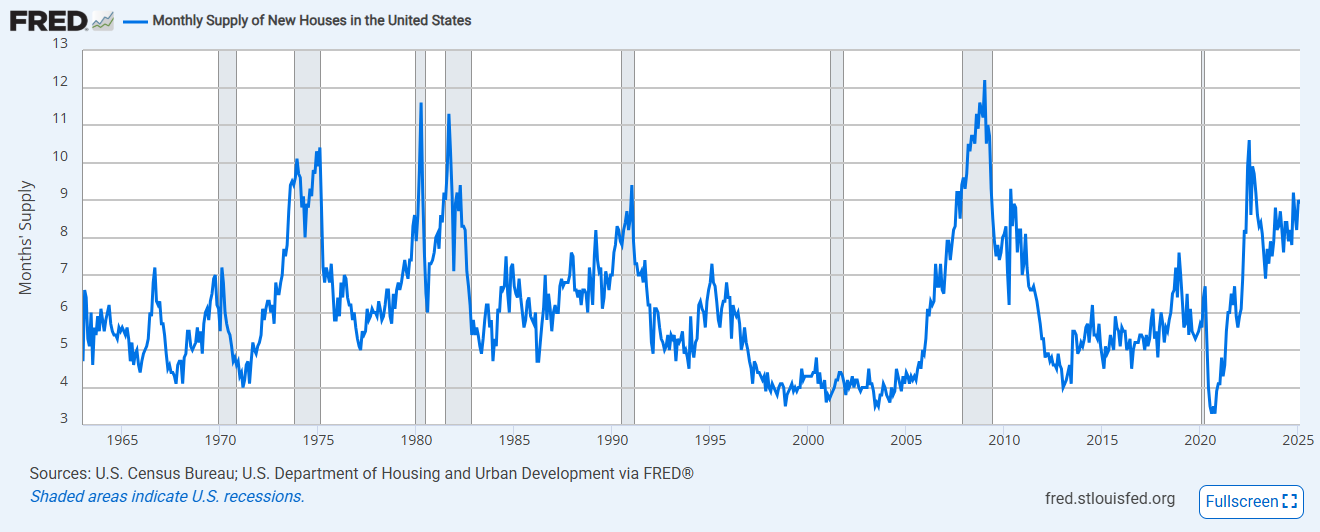
US New Home Sales
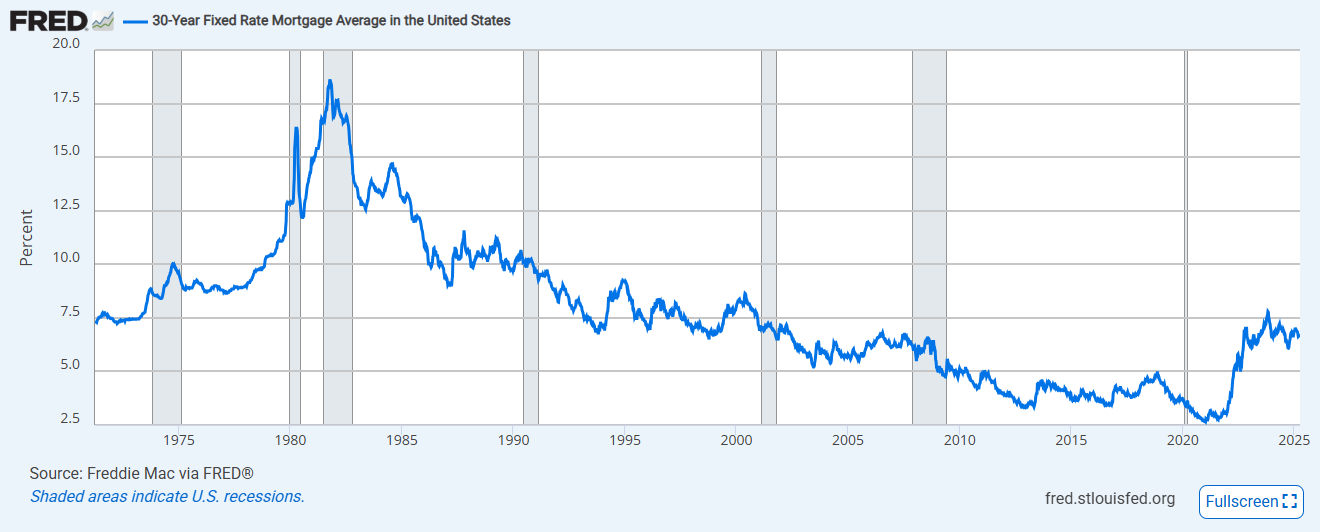
30 Year Fixed Mortgage Rates
The mortgage rates have followed the 10-year Treasury yield lower over the last couple of weeks.
Employment Indicators
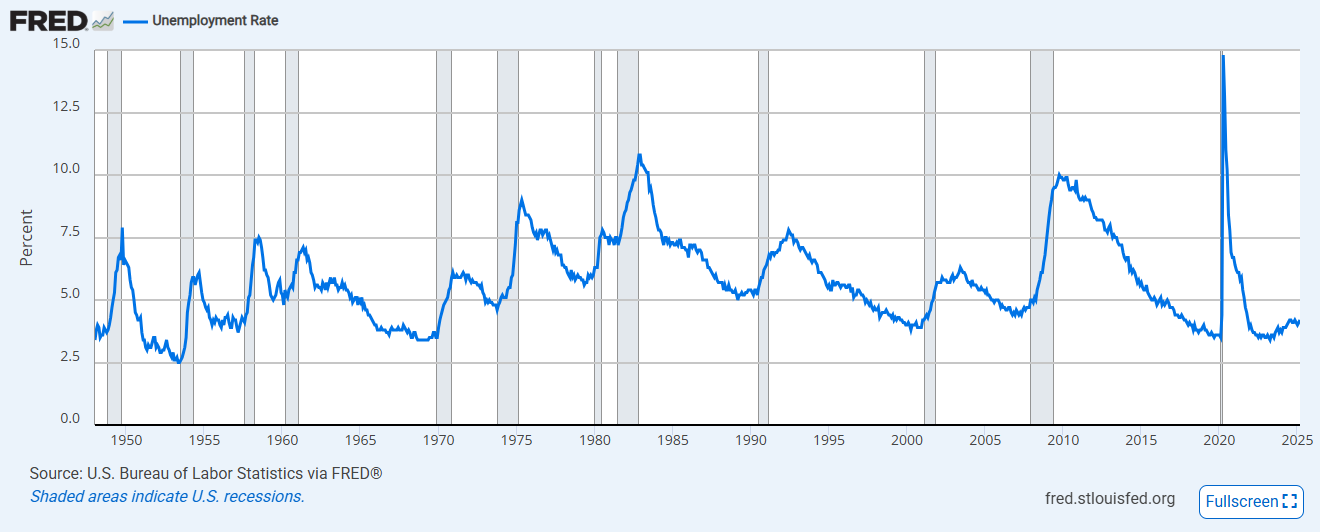
Historical Unemployment Rate
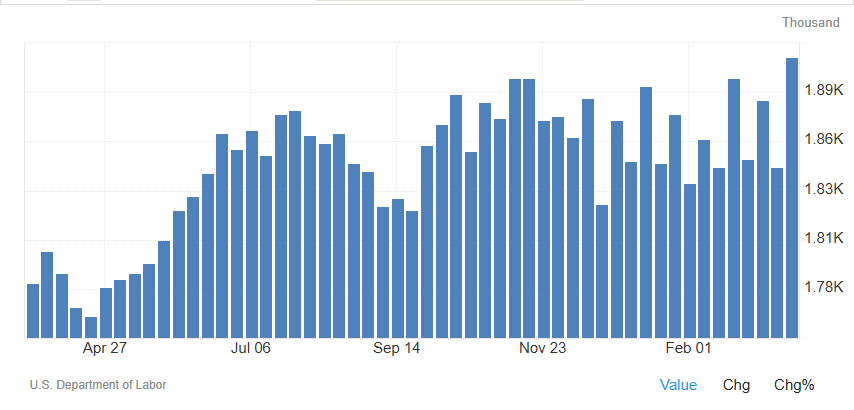
US Jobless Claims
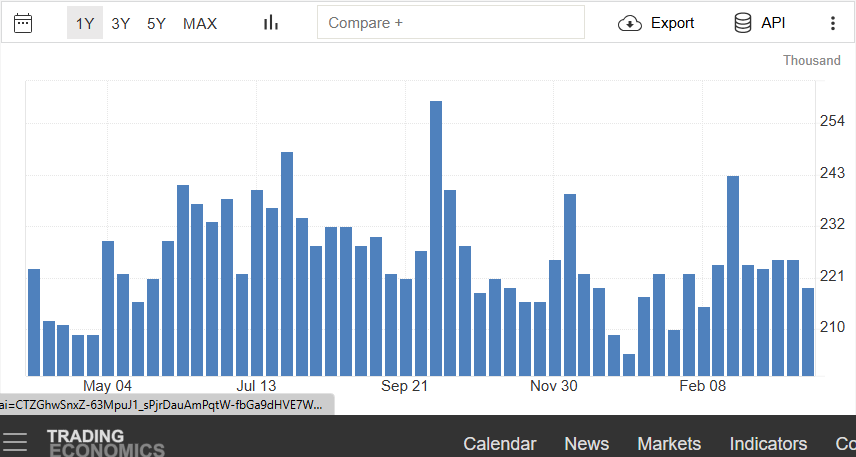
 This chart will be the first indicator of a telltale sign that unemployment is increasing. As you see the continuing
jobless claims number rise, it implies the people who lost their jobs are not going back to labor force fast enough
and the unemployment rate is starting to creep higher. Over the last couple of weeks, it has remained roughly flat.
This chart will be the first indicator of a telltale sign that unemployment is increasing. As you see the continuing
jobless claims number rise, it implies the people who lost their jobs are not going back to labor force fast enough
and the unemployment rate is starting to creep higher. Over the last couple of weeks, it has remained roughly flat.
Market Indicators
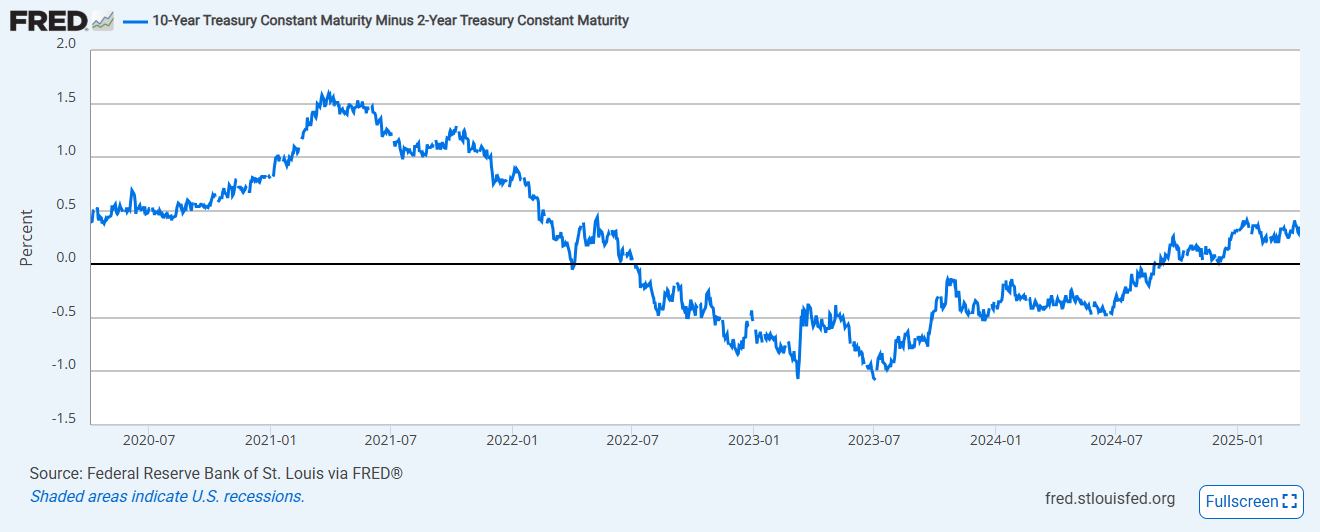
Yield Curve Inversion
Yield Curve - then and now
 Yield curve - Then
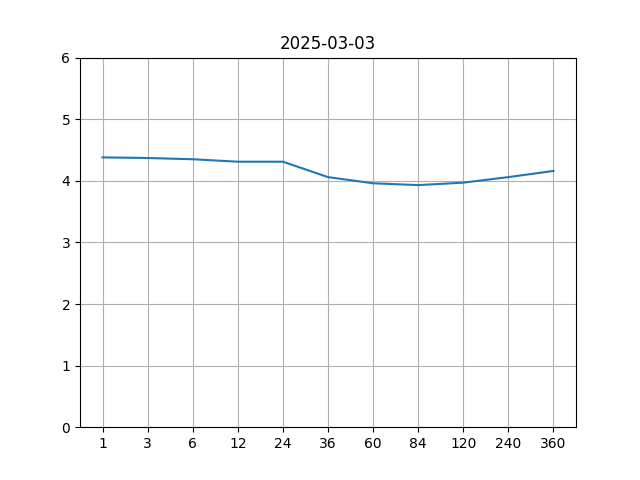
 Yield curve - Now
 The yield curve is certainly reverted back to normal. Over the last few weeks, the long end of the rates have edged lower.
Market Sectors
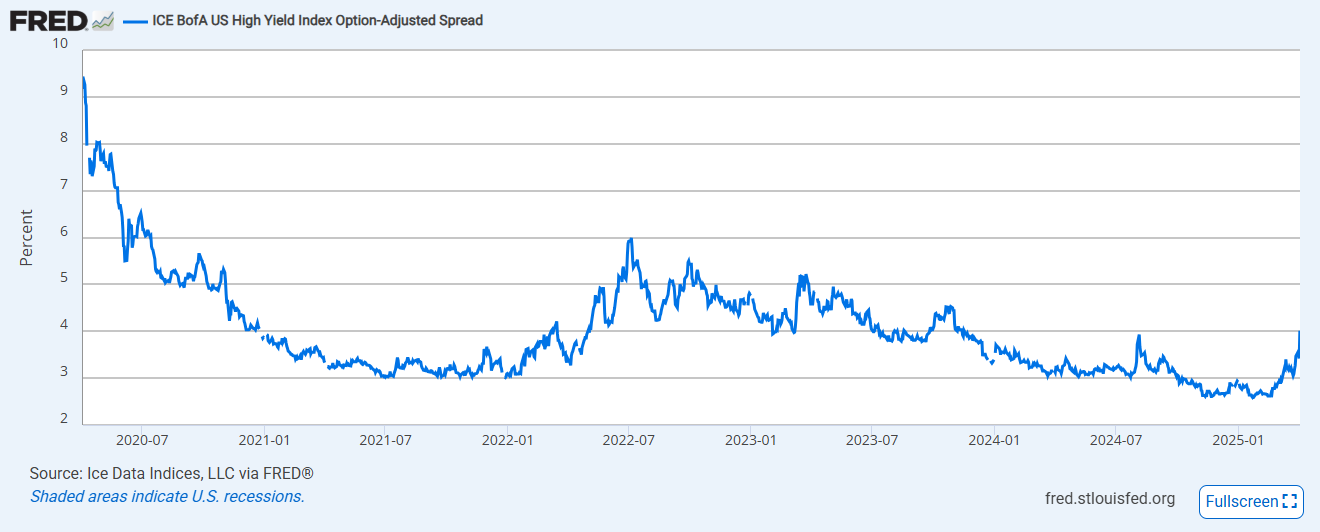
High Yield Index Options-Adjusted Spread
If the economy were to enter a recession, it is likely that some of the companies will struggle to keep up with their debt payments causing their credit spread to widen. This indicator shows how the credit spreads have been behaving well so far even in the face of the Yen carry trade unwind.
The spread is 2.99% currently and it is starting to widen from the tightest levels we have seen recently.
Put Call Ratio
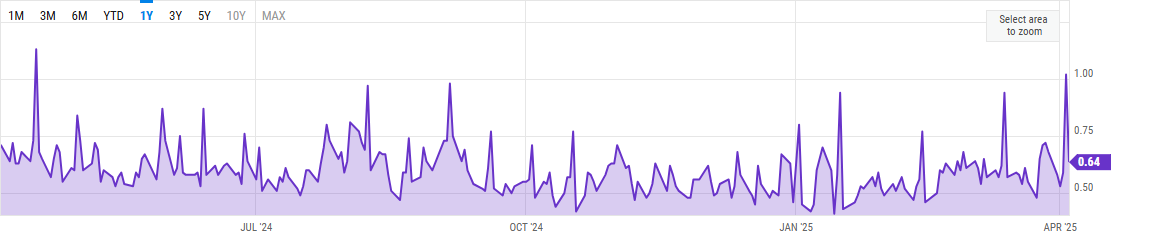
A spike in put / call ratio indicates that investors are very apprehensive about a sudden fall in the equity markets.
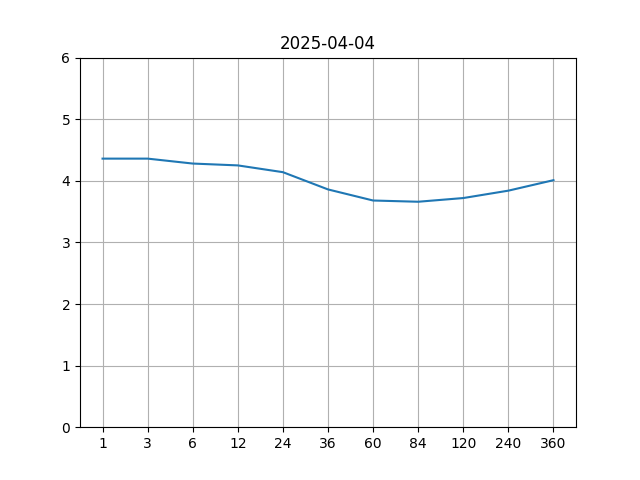
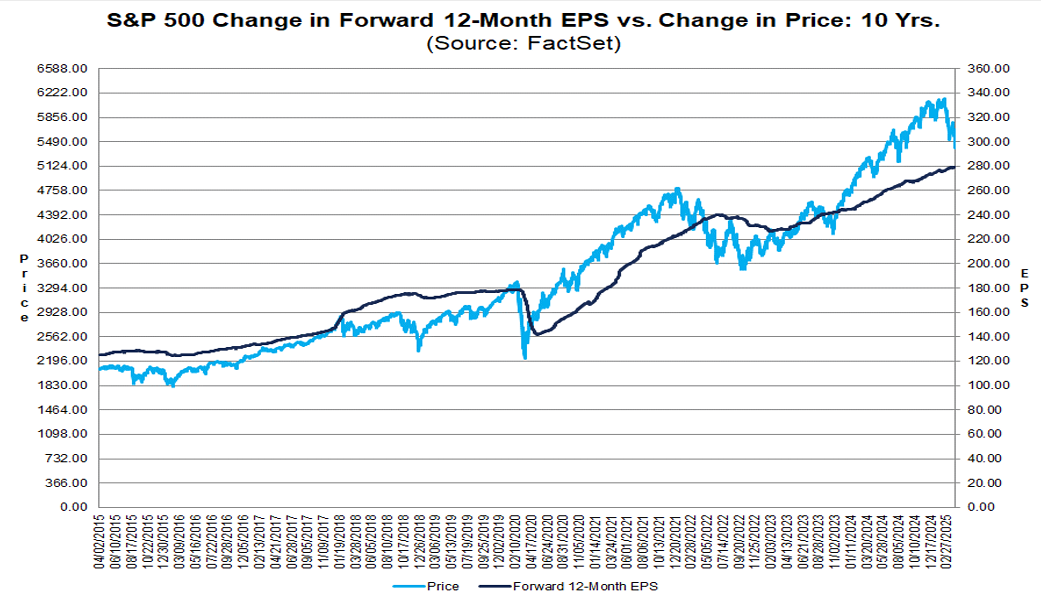
S&P 500 Current Valuations
The current earnings forecast by equity analysts estimate the earnings potential for S&P 500 companies to be around $280 which translates to a price to earnings ratio of 20.7 at the current S&P 500 price level. This is above the 5 year and the 10 year averages. The market still remains pricey.
Disclosures
- Trillium Square Advisors LLC is a registered investment adviser offering advisory services in the state of North Carolina and in other jurisdictions where exempted. Registration as an investment adviser does not imply a certain level of skill or training, and the content of this communication has not been approved or verified by the United States Security and Exchange Commission or by any state securities authority.
- Information presented is for educational purposes only and does not intend to make an offer or solicitation for the sale or purchase of any specific securities, investments or investment strategies. Market data, articles and other content in this presentation are based on generally available information and are believed to be reliable. Trillium Square does not guarantee the accuracy of the information contained in this presentation. The information is of a general nature and should not be construed as investment advice and relied upon in making investment decisions.
- Investments involve risk and are never guaranteed. Be sure to first consult with a qualified financial adviser before implementing any strategies discussed herein.
- Past performance is not indicative of future performance.
- The content of this communication and any accompanying documents are not to be copied, excerpted or distributed without express written permission of the firm. Any other use beyond its author's intent, distribution or copying of the contents of this presentation is strictly prohibited. Nothing in this document is intended to be legal, accounting, or tax advise, and is for informational purposes only.
- Hypothetical performance results have many inherent limitations. No representation is being made that any account will or is likely to achieve profits or losses similar to those shown. In fact, there are frequently sharp differences between hypothetical performance results and the actual results subsequently achieved by any particular investment strategy. Hypothetical performance for illustration purposes only.
- Trillium Square will provide all prospective clients with a copy of our current Form ADV, Part 2A (Disclosure Brochure) upon request. At anytime you can view our current Form ADV, Part 2A at https://adviserinfo.sec.gov