Economic Updates for August 2024
Summary
August Market Turbulence: Is the Economy Heading for Recession?
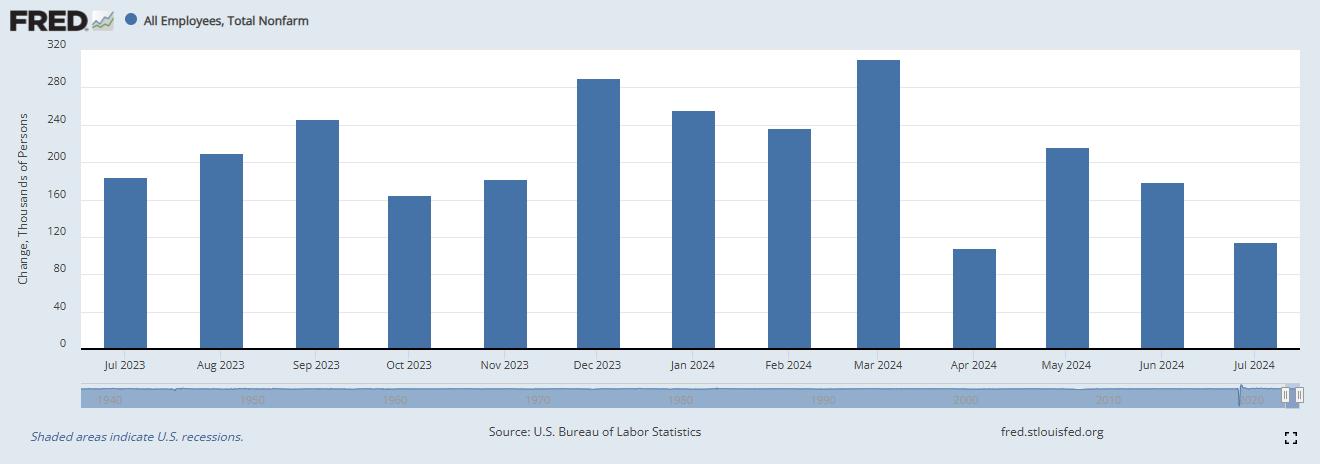
The month of August has brought an explosion of news and market movements. It started with a lower-than-expected print in non-farm payrolls, which spooked the market into a sell-off that was exacerbated by the Yen carry trade unwind following the Bank of Japan pushing their rates above zero.
Thankfully, the episode ended within a few days. The Services PMI number came in favorably above 50, followed by tame continuing claims. The inflation numbers were very soft and followed the trend lower. Market participants are convinced the economy is slowing; however, it is probably not in a recession yet.
To dig further into the market volatility, the non-farm payrolls number triggered the Sahm rule, which states that if the three-month average of the U.S. unemployment rate rises by 0.5% or more from its 12-month low, a recession is underway. This rule serves as a shortcut to determine if the economy is in a recession instead of waiting for the NBER to declare it two quarters later.
This time, however, there are reasons to believe we are safe, and the Sahm rule may be a false positive. Many market strategists believe the rising unemployment numbers are due to an expanding employable population driven by immigration.
Even if we are heading into a recession, the Fed is sitting on a pile of ammunition with short-term rates at 5+%. They can come to the rescue by lowering rates. It is widely anticipated that they will do exactly this in their September meeting. The market may be setting up for disappointment if that fails to happen.
Broad Indicators
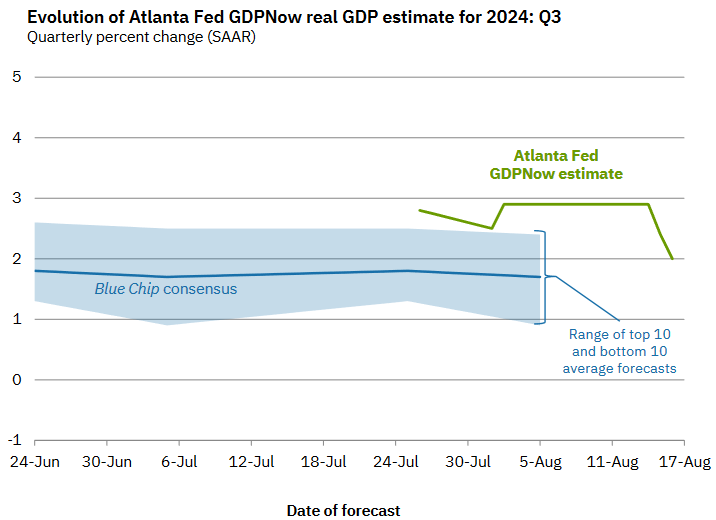
Atlanta GDP NowCast
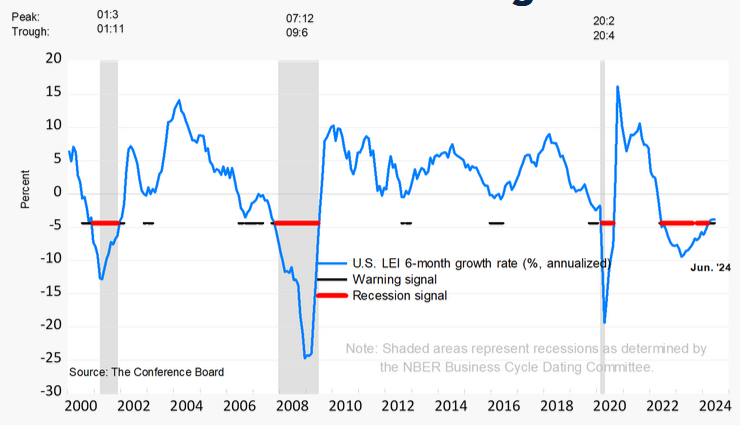
Conference Board's Leading Economic Indicator
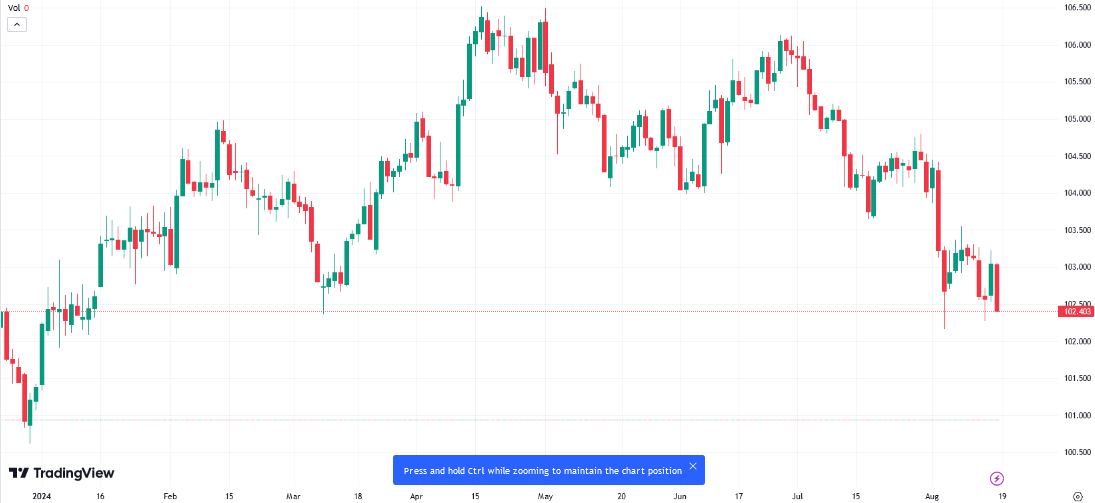
US Dollar Index
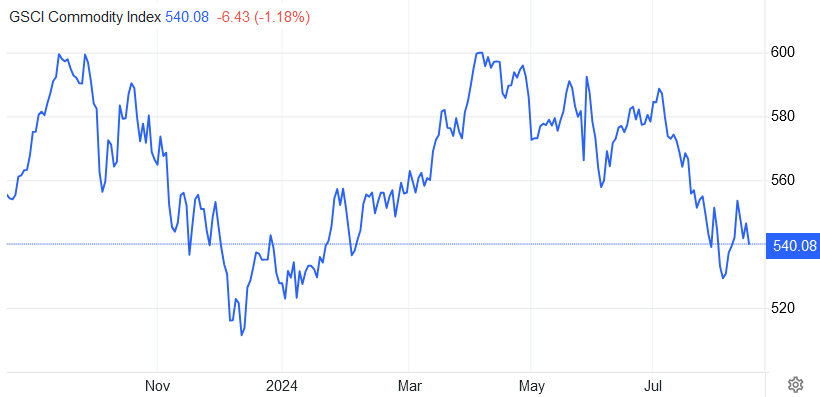
Commodities
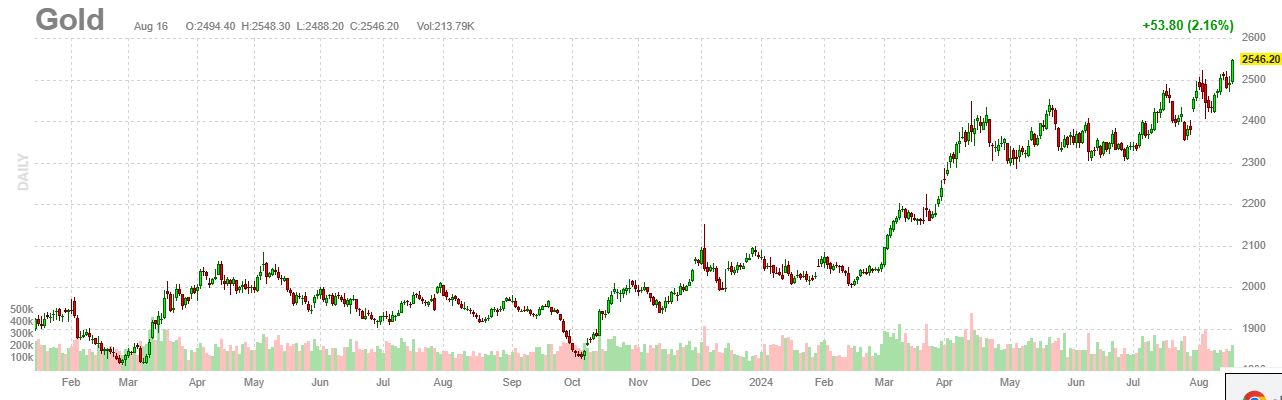
Gold
Gold has been an exceptional performer this year. Slowing Chinese economy and booming Indian economy has certainly contributed. In addition, Central banks around the world have started preferring Gold to US Treasuries lately.
Bitcoin
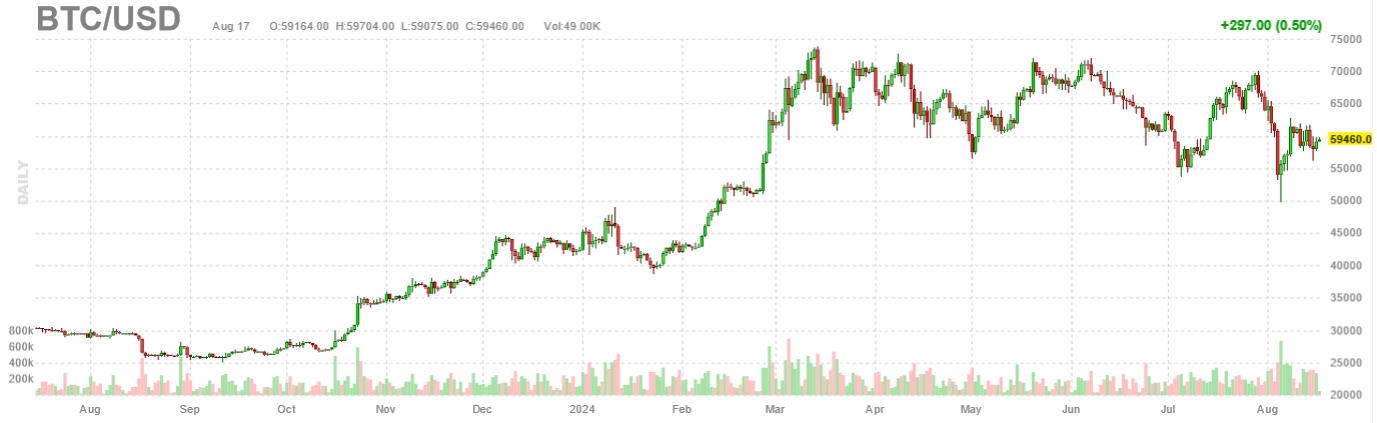
It is interesting to see that Gold has diverged from BitCoin. BitCoin remains under pressure and has behaved more like a risk asset such as tech stocks. The recent Yen carry trade unwind has impacted BitCoin.
Inflation
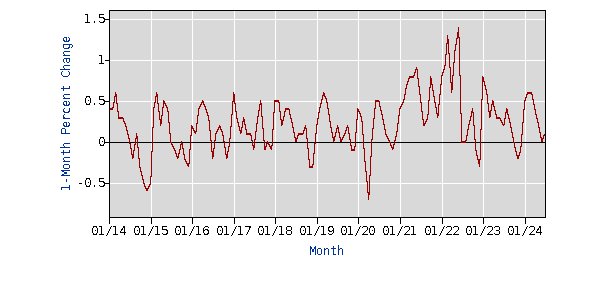
CPI Month over Month
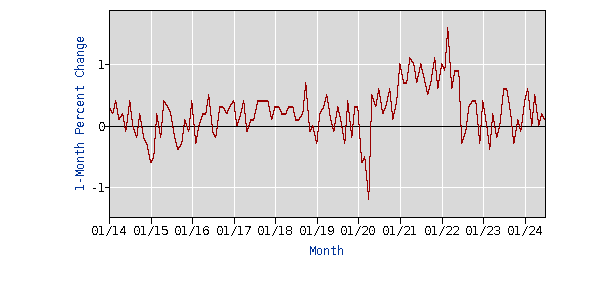
PPI Month over Month
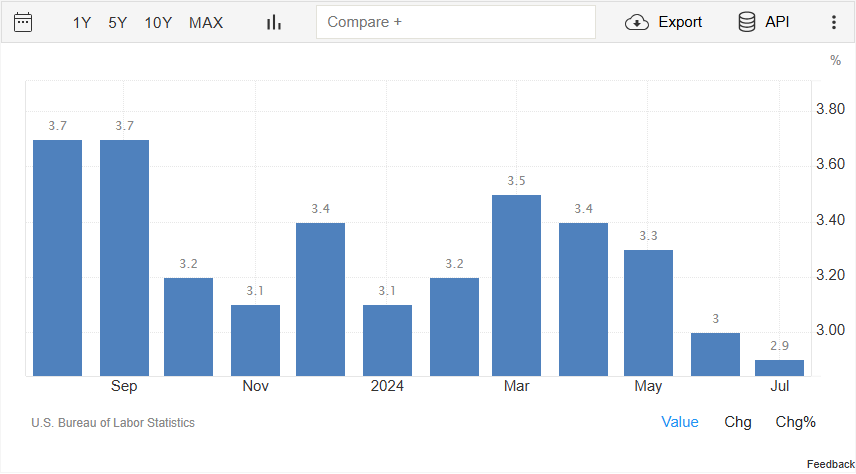
Reported Year over Year Inflation Rate
CPI Components
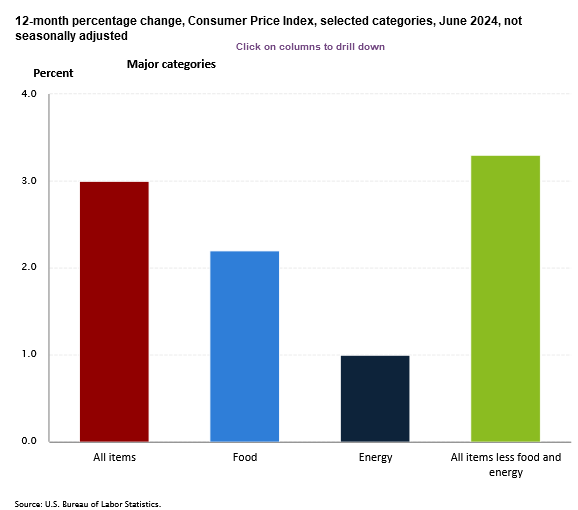 CPI Components Last Month
Source BLS.gov Consumer Price Index
CPI Components Last Month
Source BLS.gov Consumer Price Index
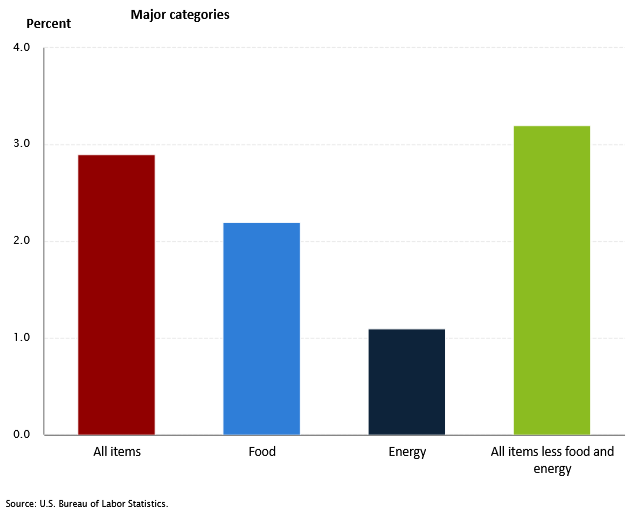 CPI Components This Month
The contributors to inflation have remained fairly consistent compared to last month. (Please note that the y-axis in both the graphs have different scales).
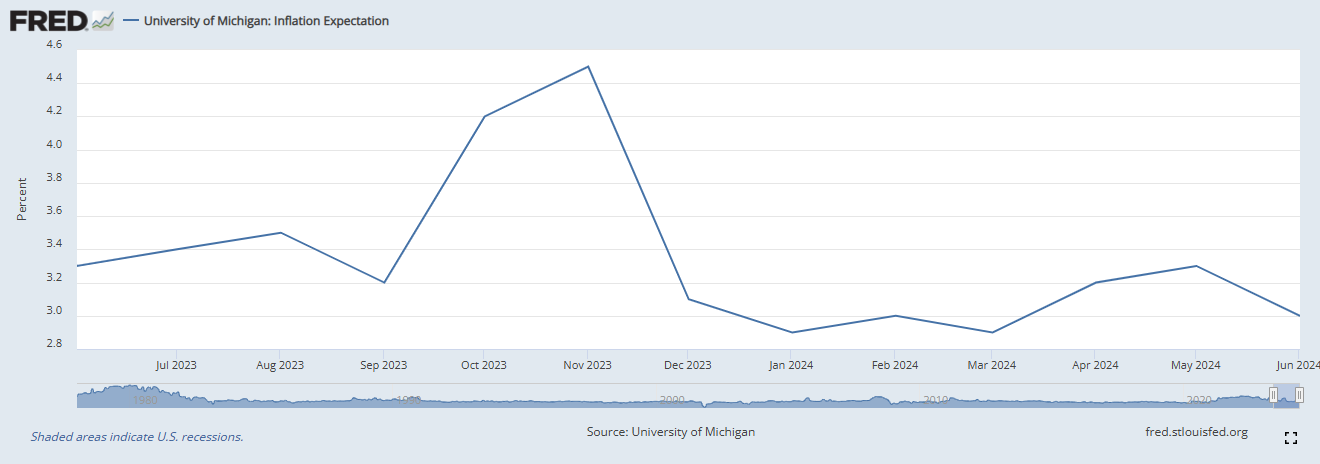
One Year Inflation Expectations
Sentiments
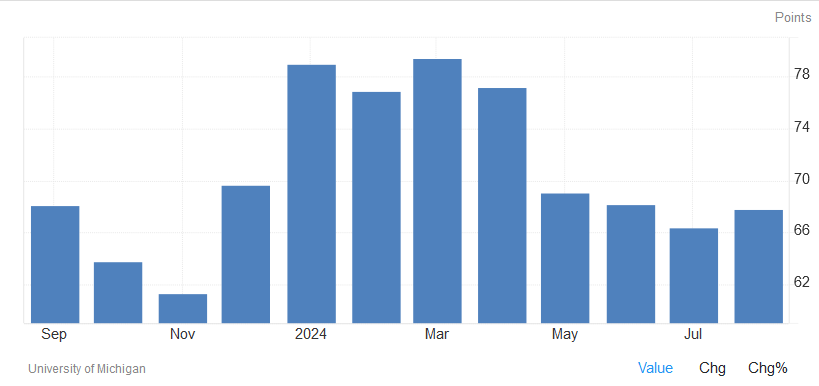
Consumer Sentiments
Investor Sentiments
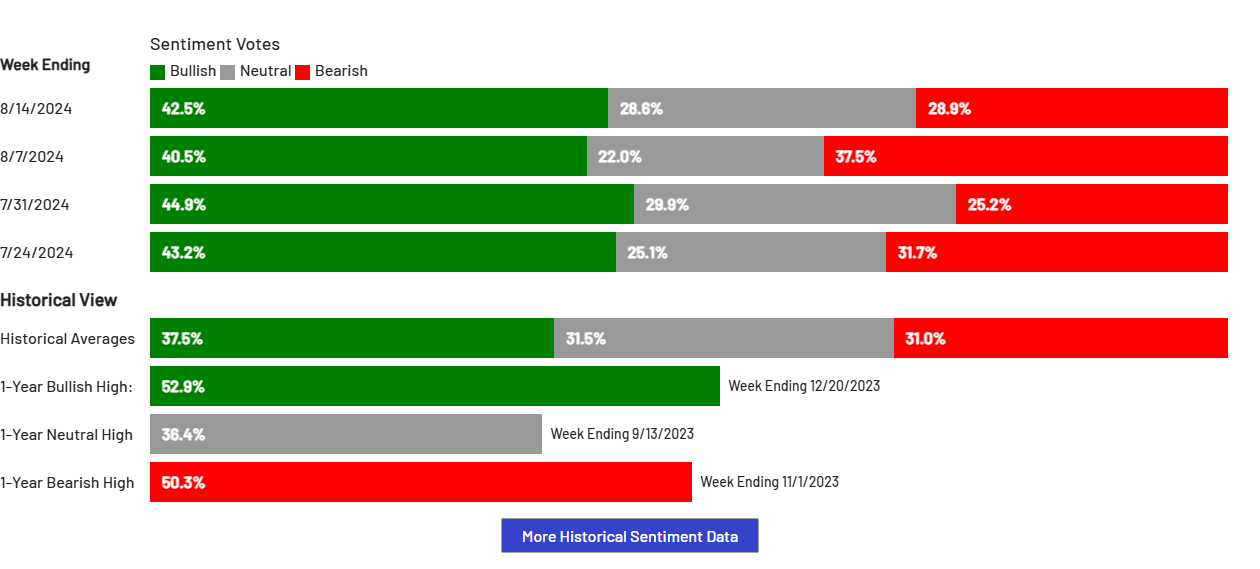
The AAII sentiment took a dive earlier this month when the market fell sharply during the Yen carry trade unwind. The sentiment has reverted back since then.
GDP Factors
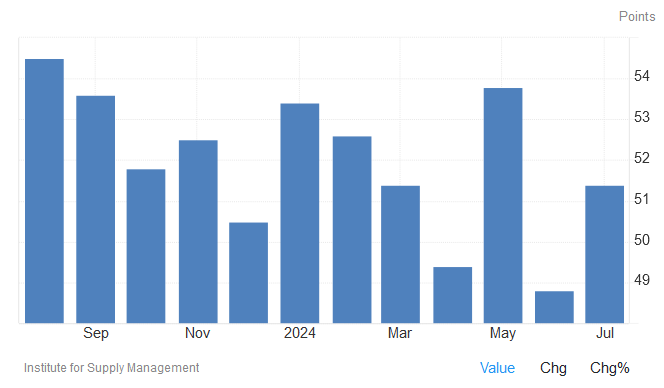
Manufacturing PMI
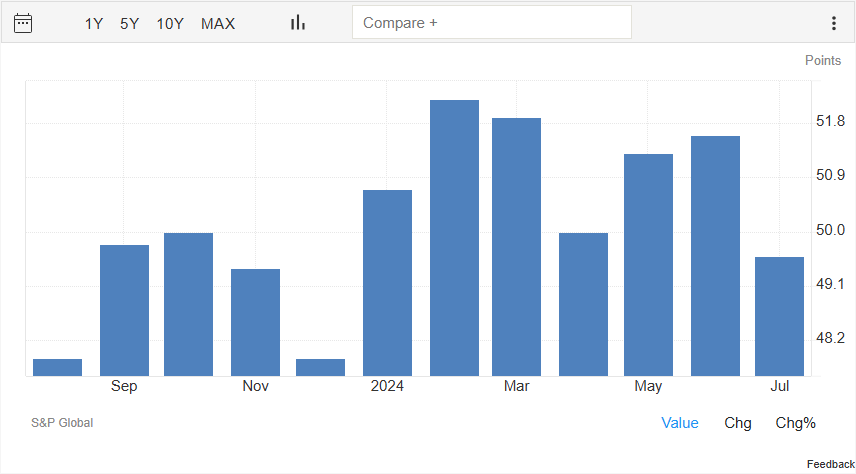
Services PMI
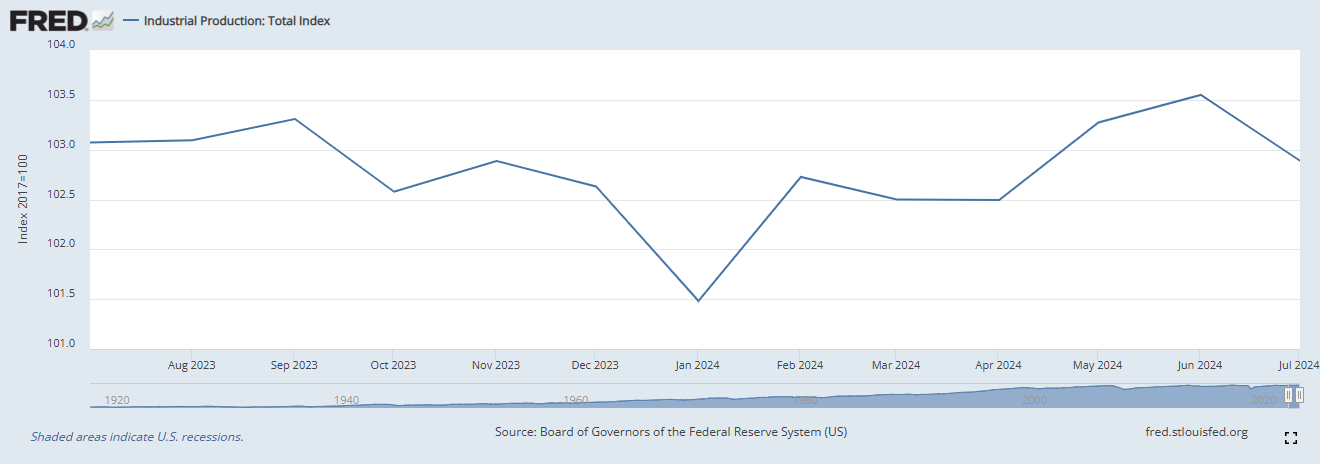
Industrial Production
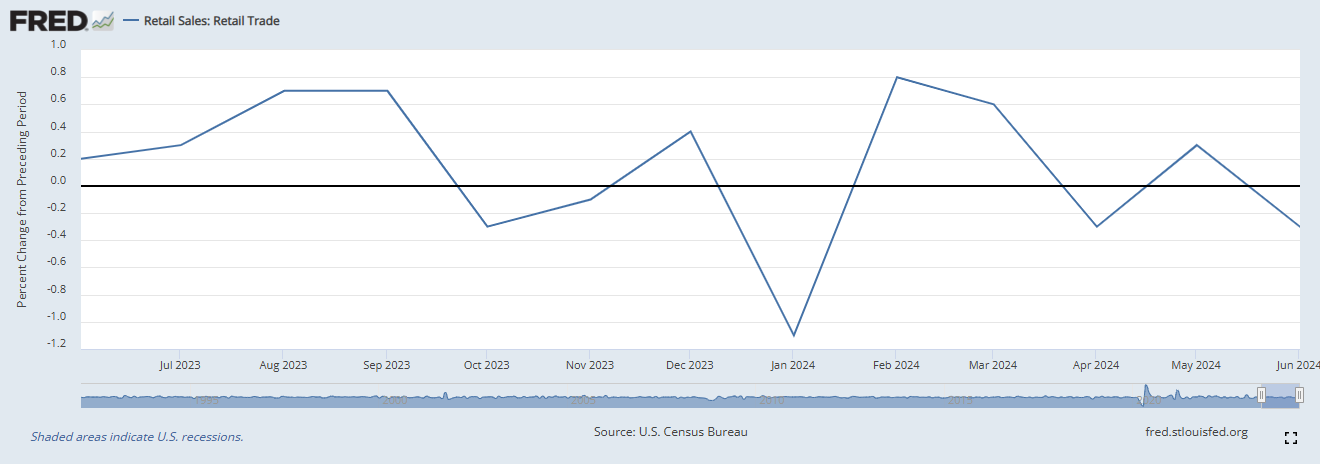
Retail Sales
Non-farm Payrolls
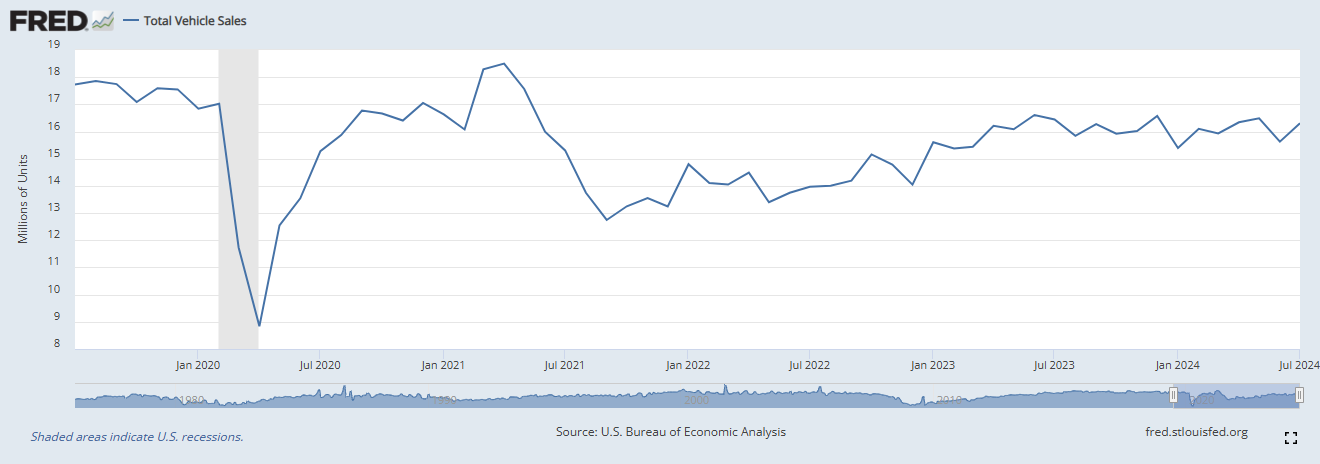
Total Vehicle Sales
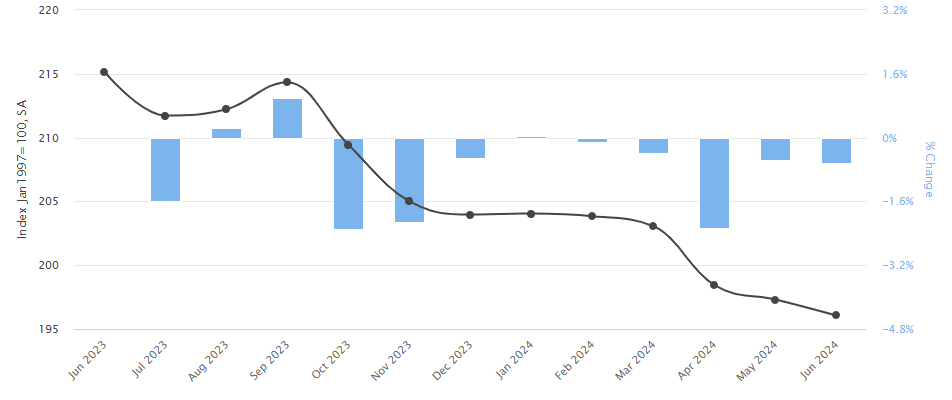
Manheim Used Car Index
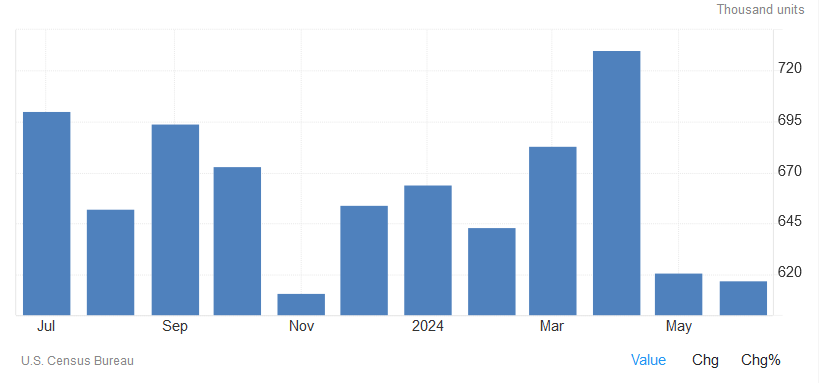
US New Home Sales
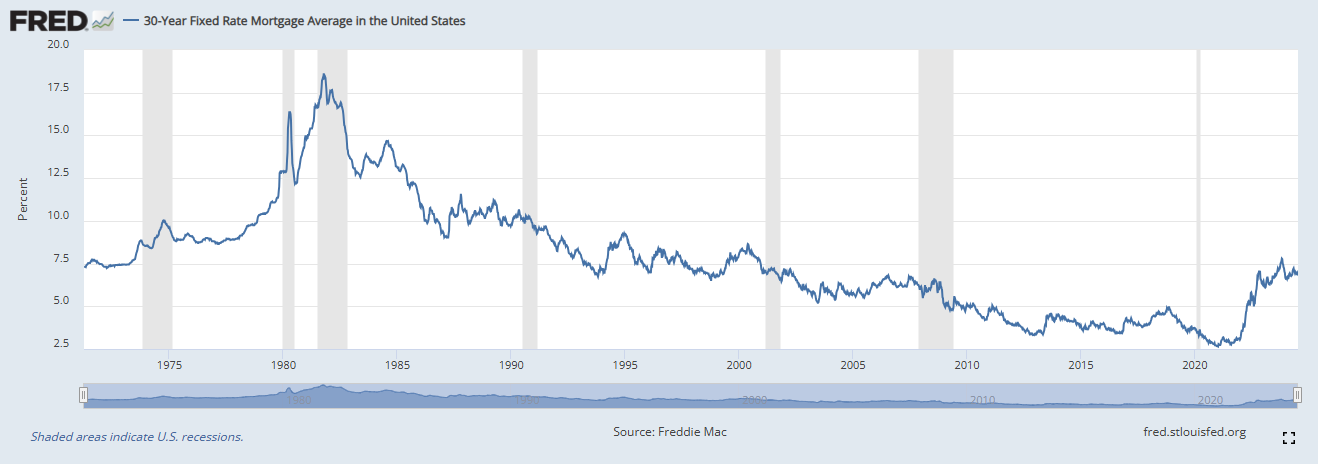
30 Year Fixed Mortgage Rates
The mortgage rates have followed the 10-year Treasury yield lower over the last few weeks due to the market panic following the Yen carry trade unwind. This is likely to be temporary.
Employment Indicators
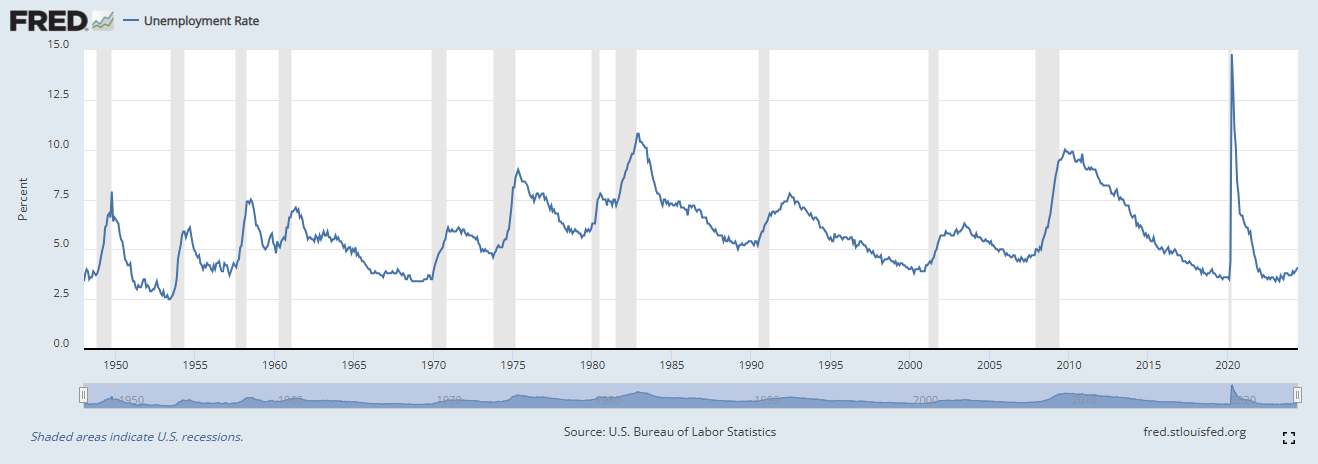
Historical Unemployment Rate
US Jobless Claims
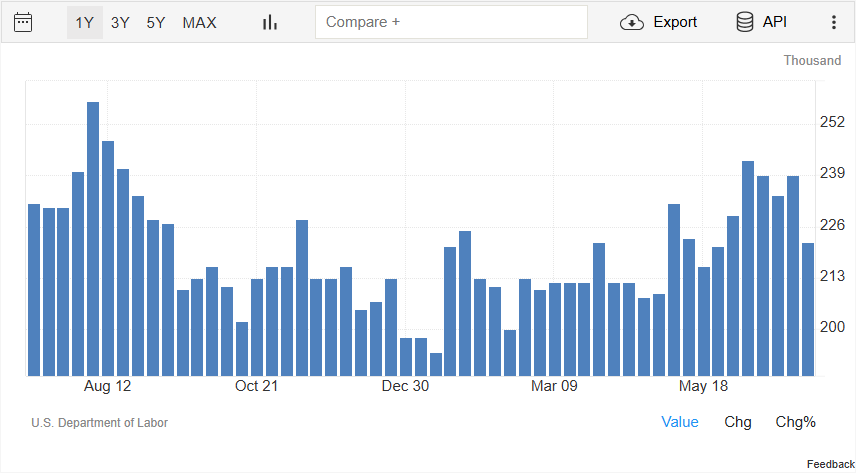
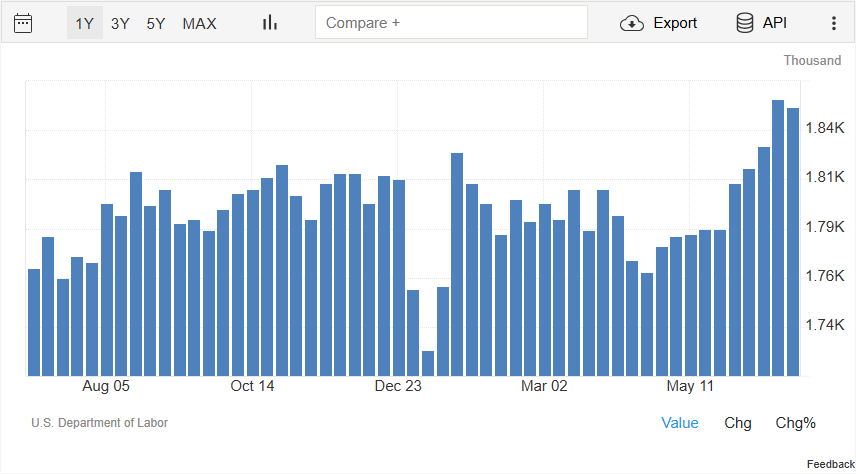 This chart will be the first indicator of a telltale sign that unemployment is increasing. As you see the continuing
jobless claims number rise, it implies the people who lost their jobs are not going back to labor force fast enough
and the unemployment rate is starting to creep higher. Over the last couple of weeks, it has trended a bit higher and
worth watching over the next few months.
This chart will be the first indicator of a telltale sign that unemployment is increasing. As you see the continuing
jobless claims number rise, it implies the people who lost their jobs are not going back to labor force fast enough
and the unemployment rate is starting to creep higher. Over the last couple of weeks, it has trended a bit higher and
worth watching over the next few months.
Market Indicators
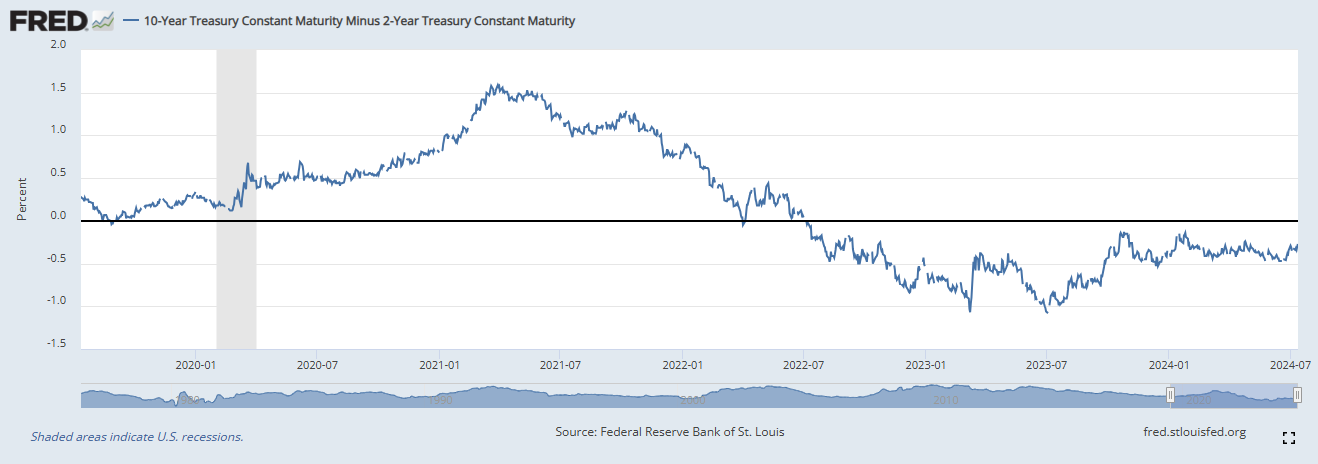
Yield Curve Inversion
Yield Curve - then and now
 Yield curve - Then
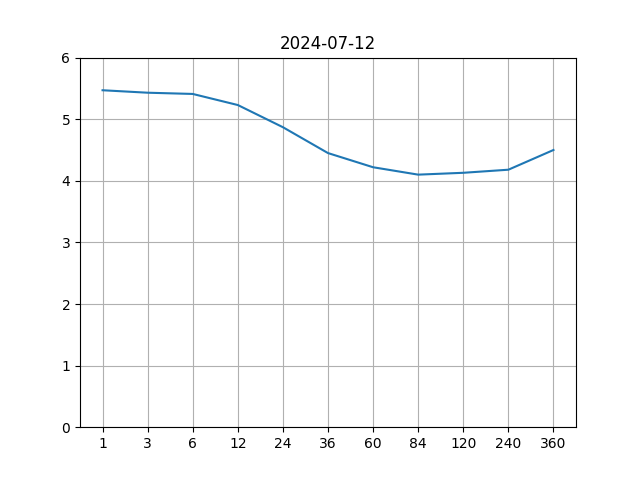
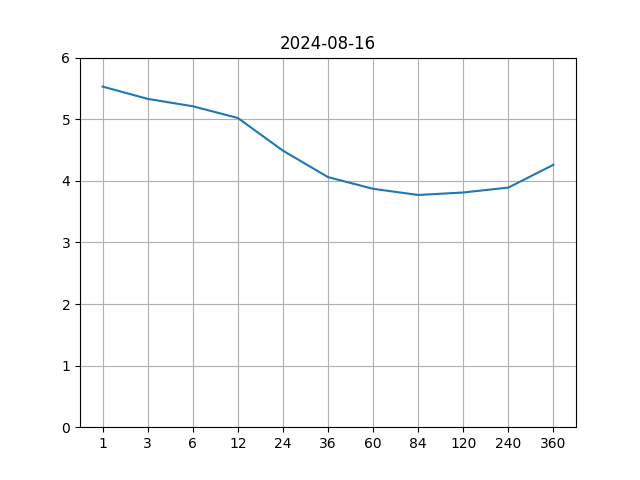 Yield curve - Now
 The yield curve inverted a bit further due to the stock market panic caused by the Yen carry trade unwind.
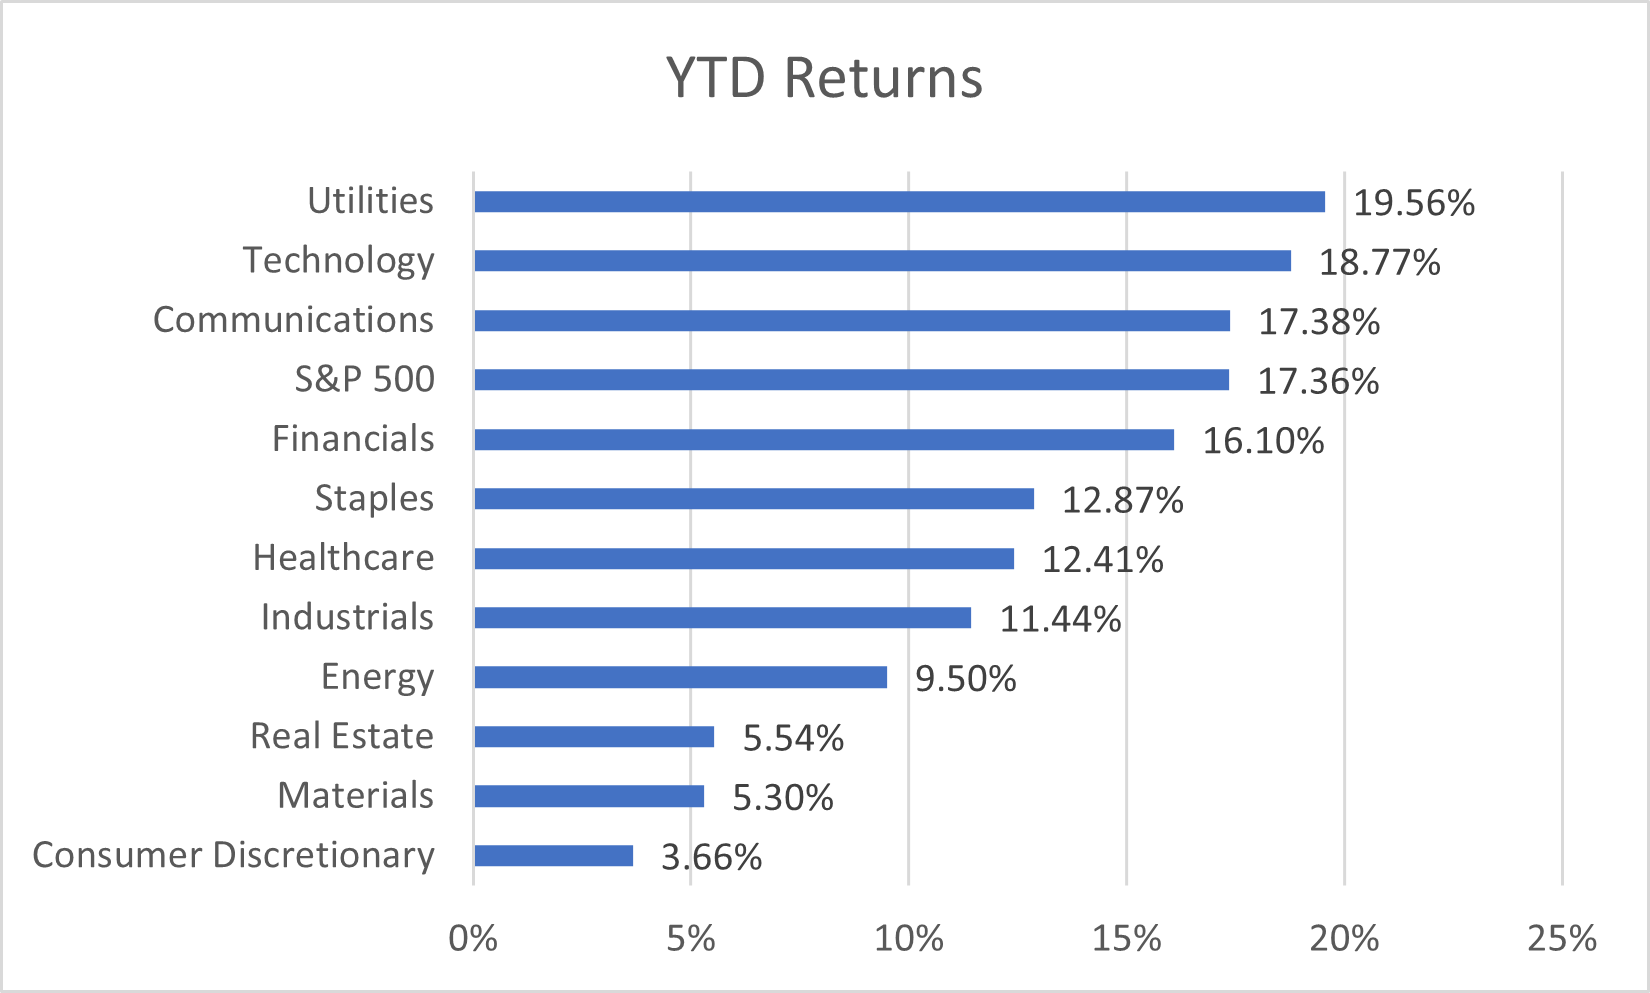
Market Sectors
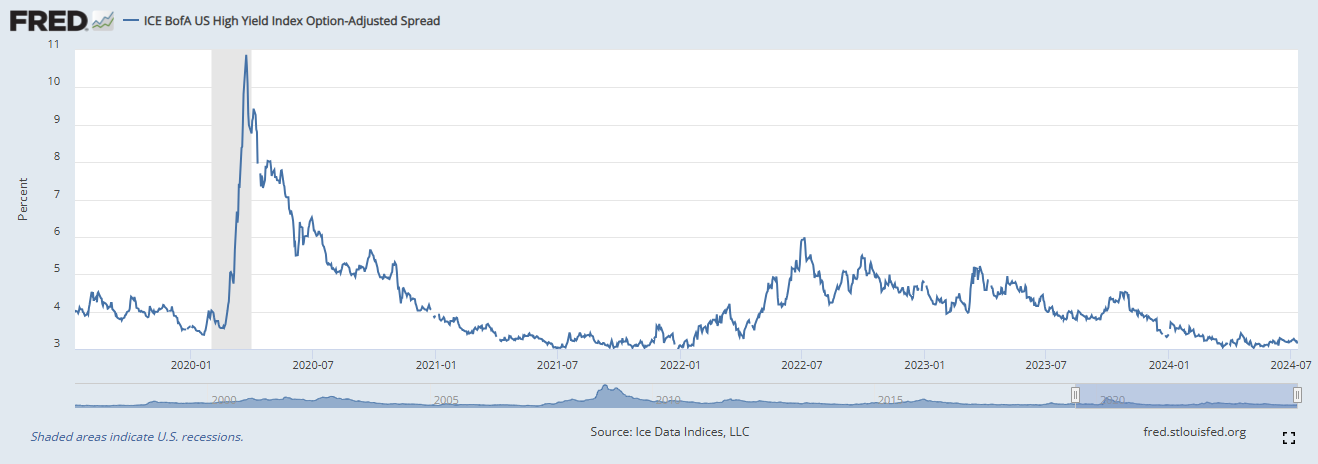
High Yield Index Options-Adjusted Spread
If the economy were to enter a recession, it is likely that some of the companies will struggle to keep up with their debt payments causing their credit spread to widen. This indicator shows how the credit spreads have been behaving well so far even in the face of the Yen carry trade unwind.
The tight spread indicate that the soft landing narrative is actually playing out.
Put Call Ratio
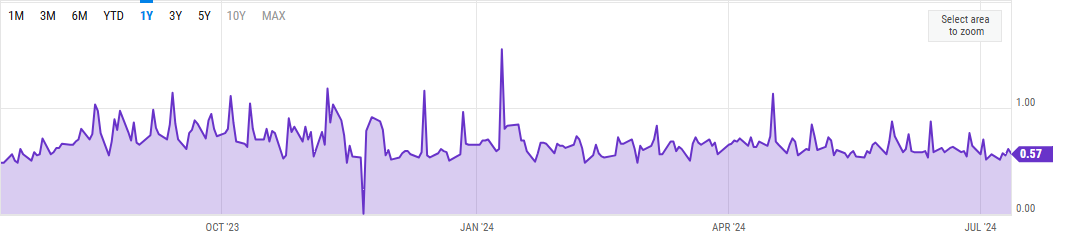
A spike in put / call ratio indicates that investors are very apprehensive about a sudden fall in the equity markets. In July/August, we have not seen any interesting activities outside a couple of days in early August due to the Yen carry trade unwind.
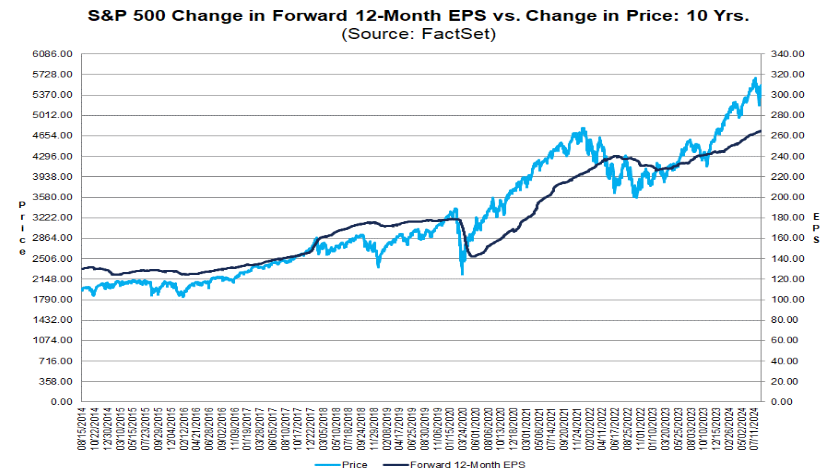
S&P 500 Current Valuations
The current earnings forecast by equity analysts estimate the earnings potential for S&P 500 companies to be around $260 which translates to a price to earnings ratio of 21.4 at the current S&P 500 price level. This is above the 5 year and the 10 year averages. The market is looking pricier by the day.
Diclosures
- Trillium Square Advisors LLC is a registered investment adviser offering advisory services in the state of North Carolina and in other jurisdictions where exempted. Registration as an investment adviser does not imply a certain level of skill or training, and the content of this communication has not been approved or verified by the United States Security and Exchange Commission or by any state securities authority.
- Information presented is for educational purposes only and does not intend to make an offer or solicitation for the sale or purchase of any specific securities, investments or investment strategies. Market data, articles and other content in this presentation are based on generally available information and are believed to be reliable. Trillium Square does not guarantee the accuracy of the information contained in this presentation. The information is of a general nature and should not be construed as investment advice and relied upon in making investment decisions.
- Investments involve risk and are never guaranteed. Be sure to first consult with a qualified financial adviser before implementing any strategies discussed herein.
- Past performance is not indicative of future performance.
- The content of this communication and any accompanying documents are not to be copied, excerpted or distributed without express written permission of the firm. Any other use beyond its author’s intent, distribution or copying of the contents of this presentation is strictly prohibited. Nothing in this document is intended to be legal, accounting, or tax advise, and is for informational purposes only.
- Hypothetical performance results have many inherent limitations. No representation is being made that any account will or is likely to achieve profits or losses similar to those shown. In fact, there are frequently sharp differences between hypothetical performance results and the actual results subsequently achieved by any particular investment strategy. Hypothetical performance for illustration purposes only.
- Trillium Square will provide all prospective clients with a copy of our current Form ADV, Part 2A (Disclosure Brochure) upon request. At anytime you can view our current Form ADV, Part 2A at https://adviserinfo.sec.gov