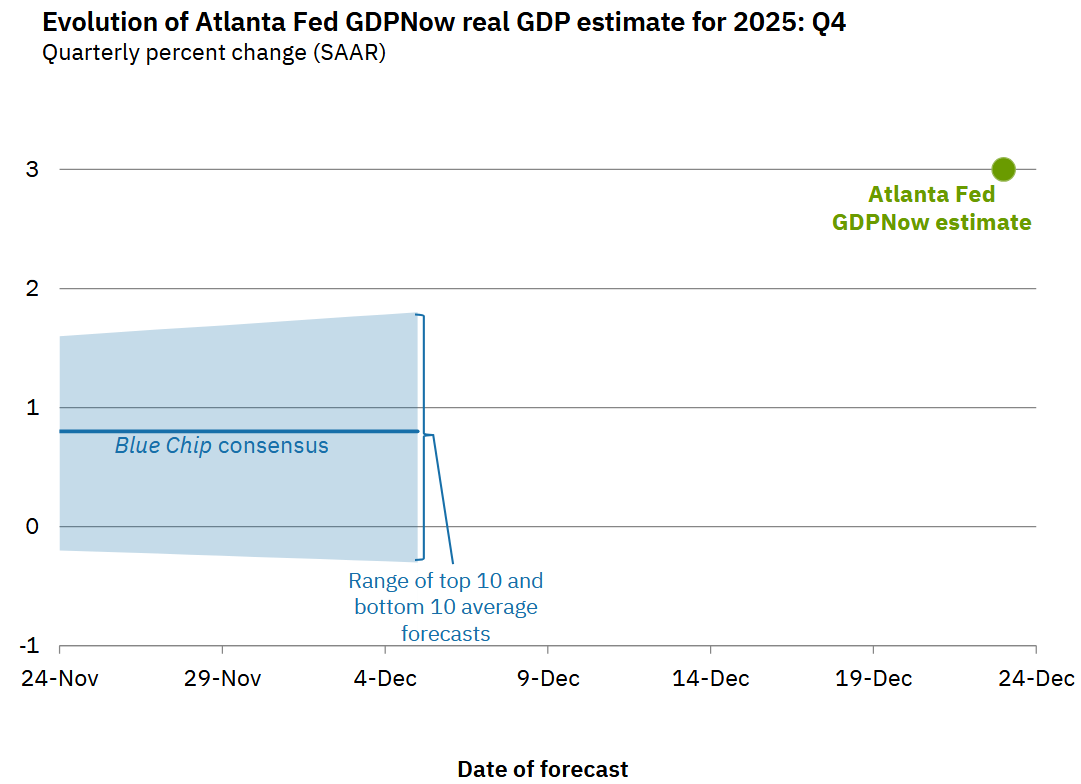
Atlanta FED GDPNow estimate is starting off at 3% for Q4 2025.
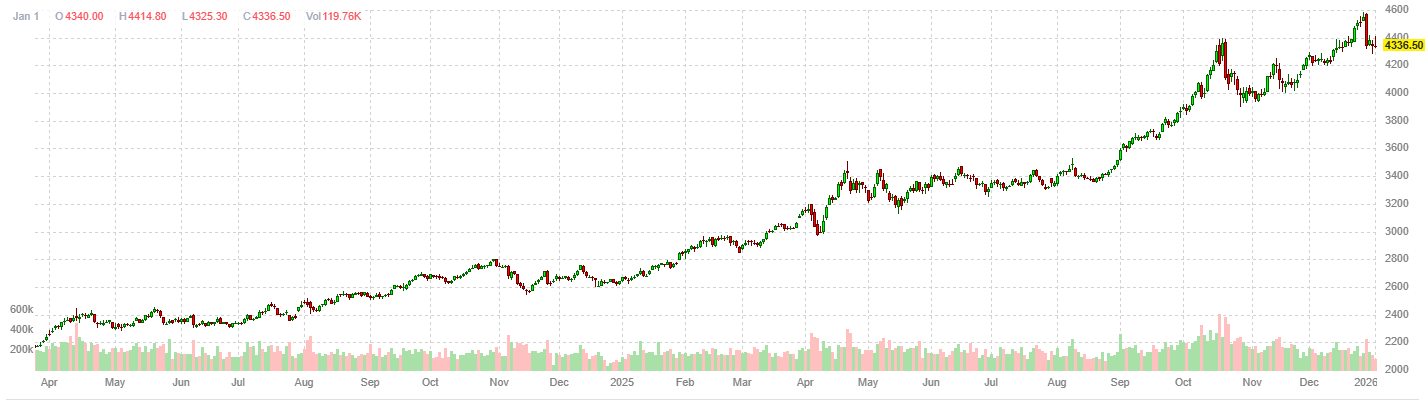
Gold has been marching higher steadily inspite of sharp intraday corrections a couple of times in Q4 2025.
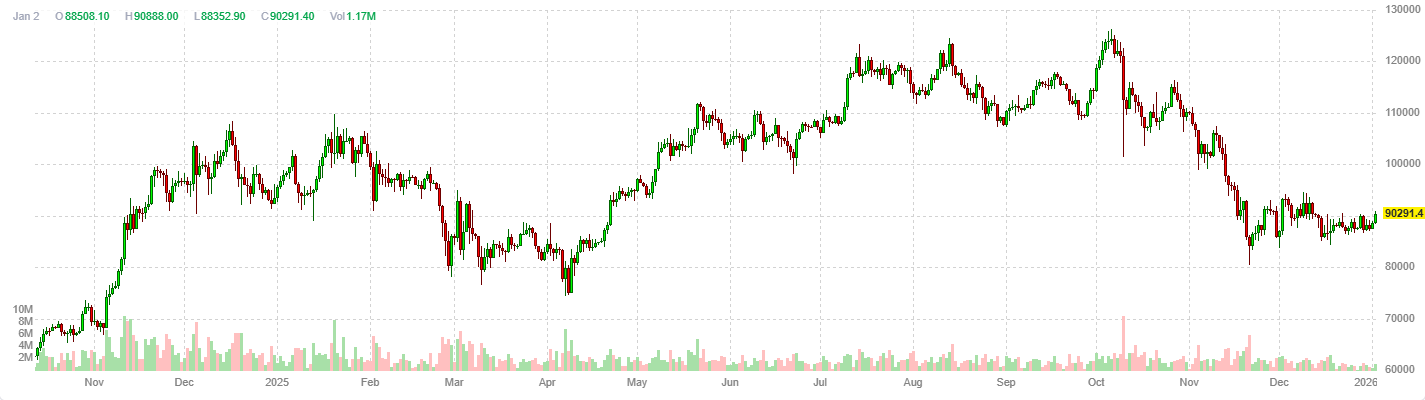
BitCoin lost some elevation in the early part of Q4 2025 and is yet to recover. It is seen diverging from Gold as well as risk assets such as mega tech stocks.
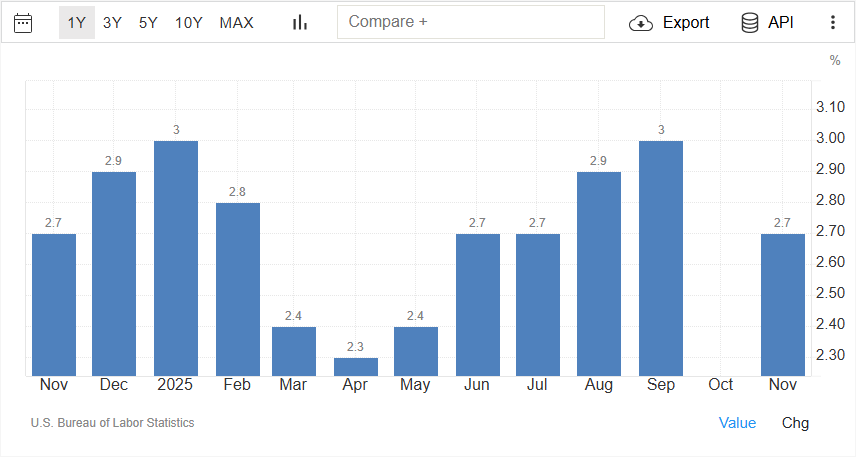
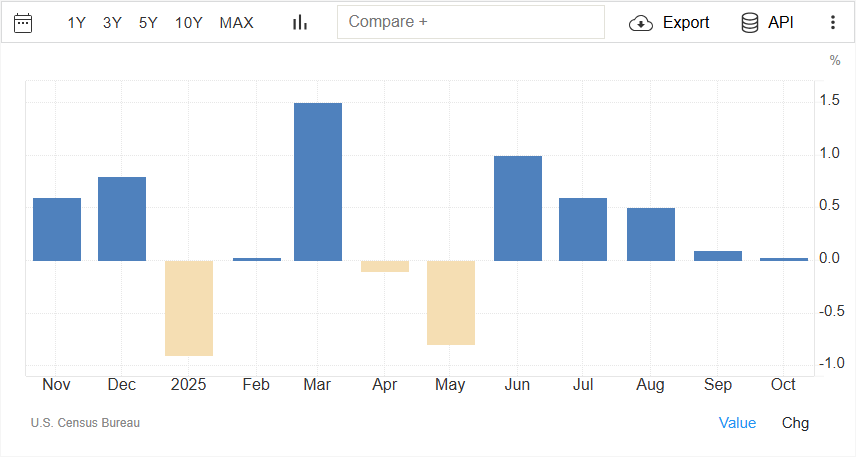
 CPI Components Last Month
Source BLS.gov Consumer Price Index
CPI Components Last Month
Source BLS.gov Consumer Price Index
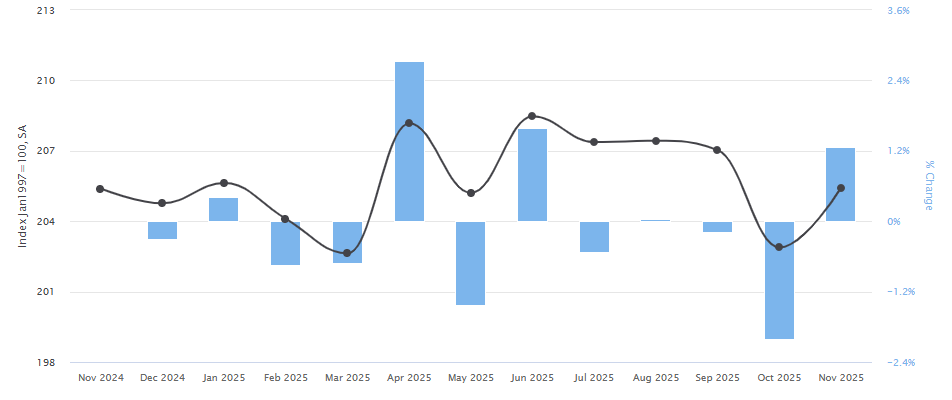
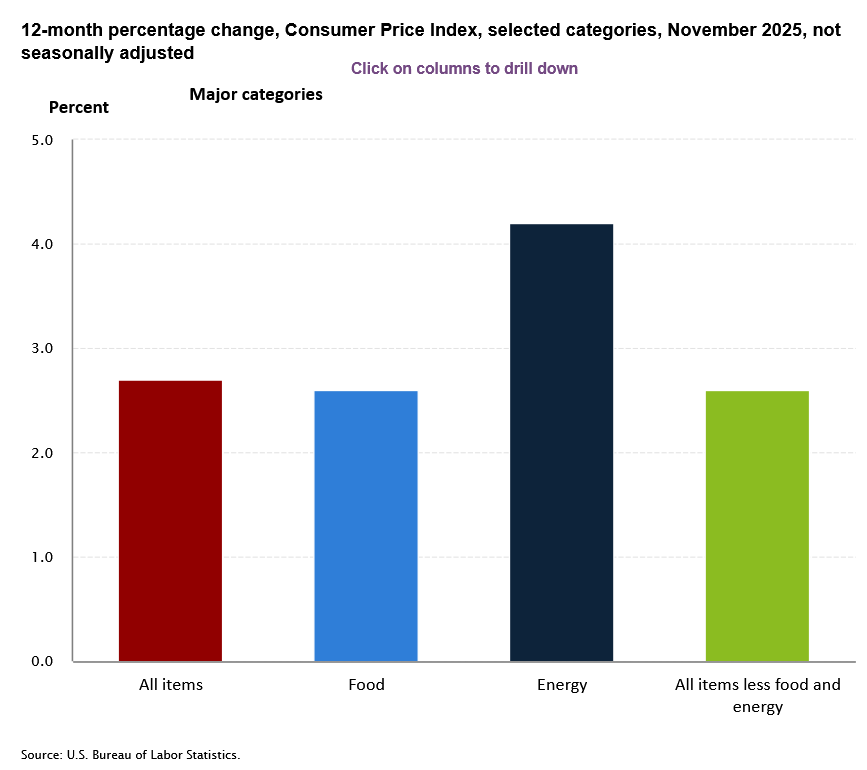 CPI Components This Month
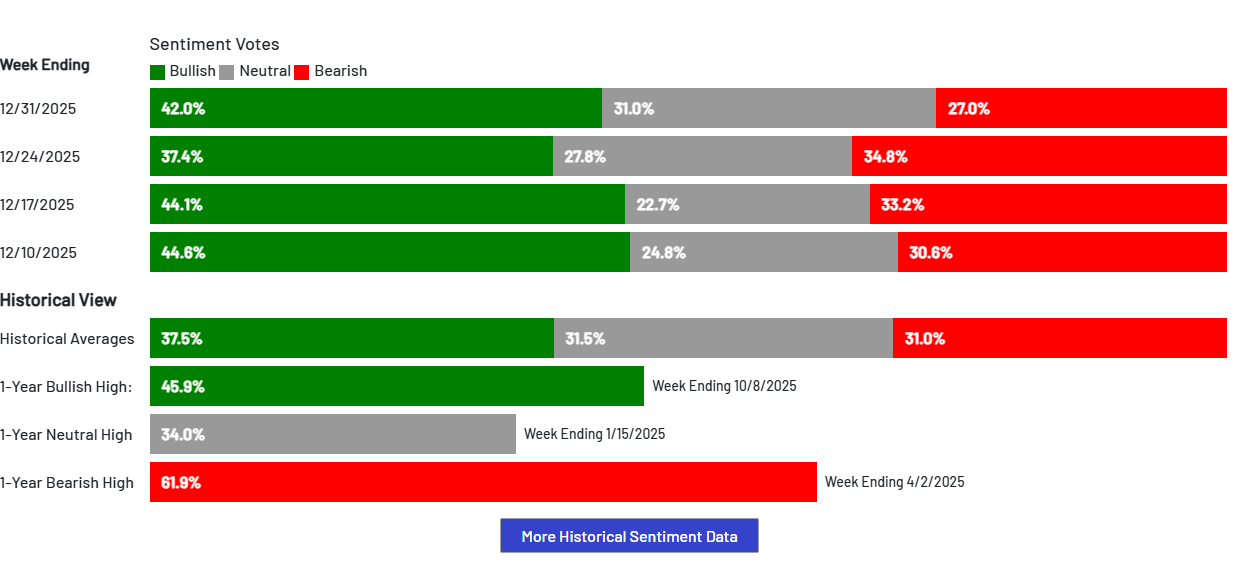
The AAII sentiment is tilted towards bullishness.
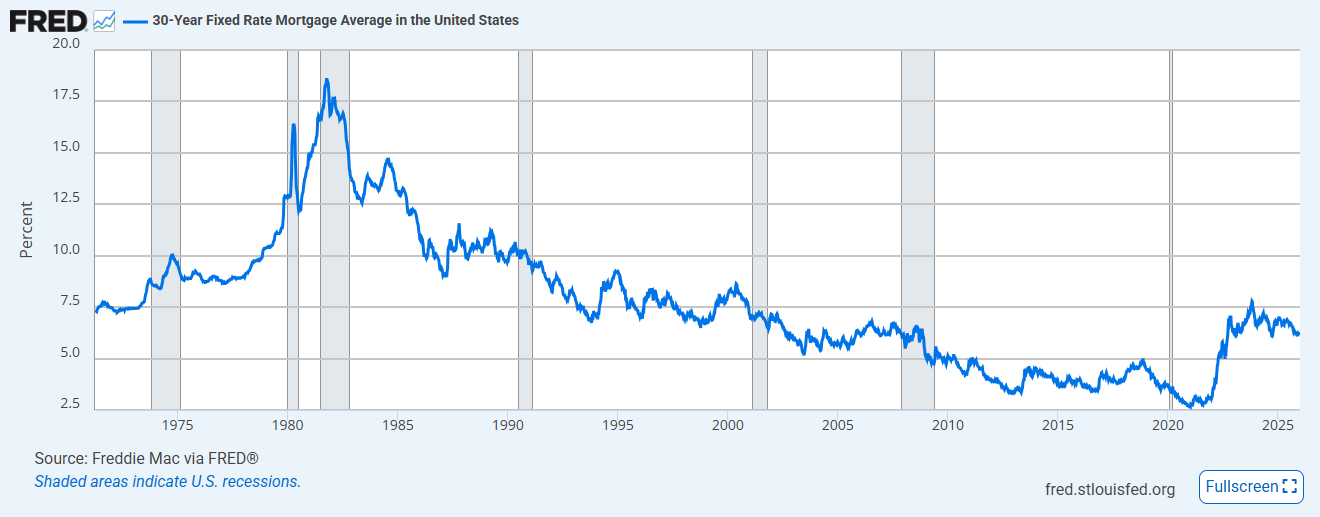
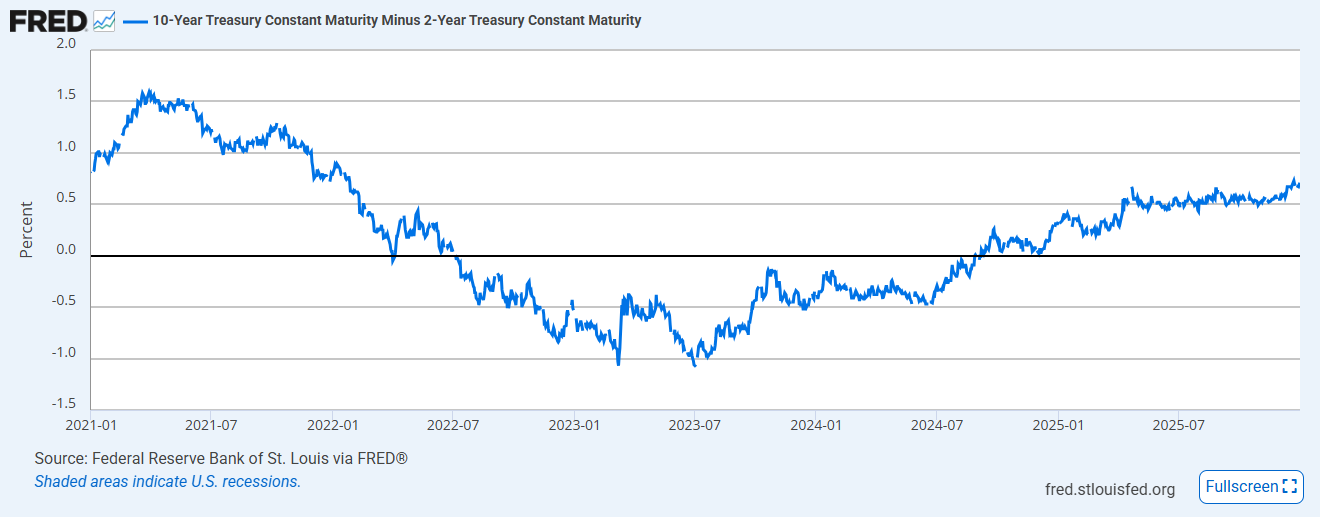
The mortgage rates have remained stubbornly higher inline with the 10-year Treasuries.
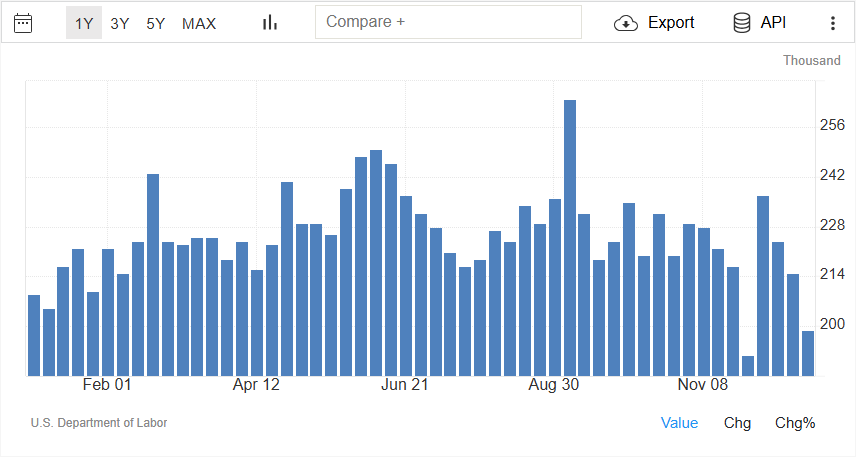
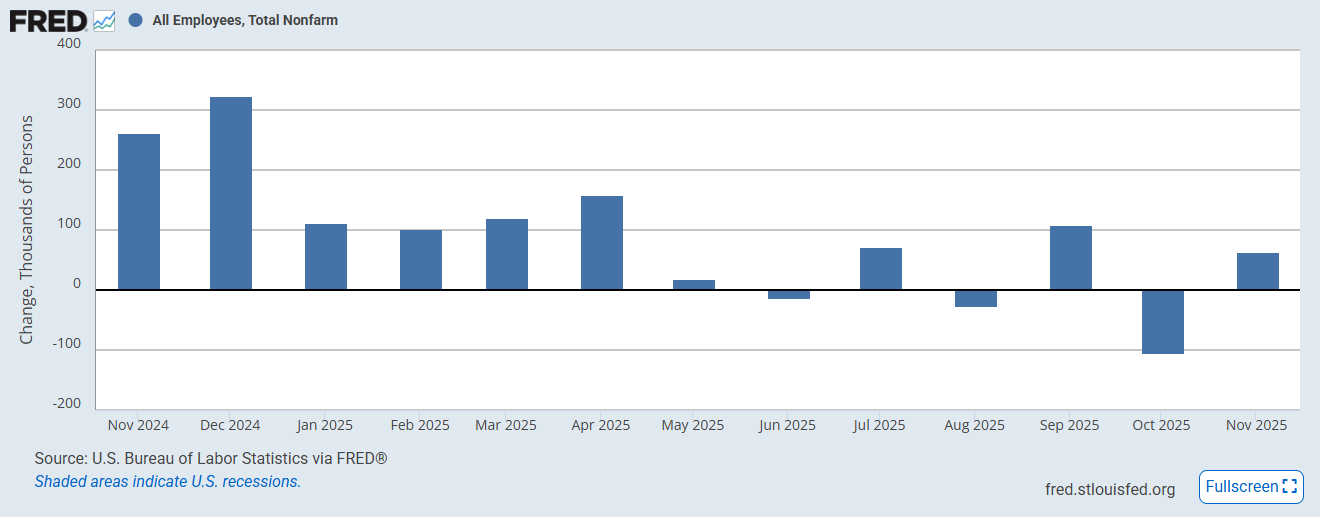
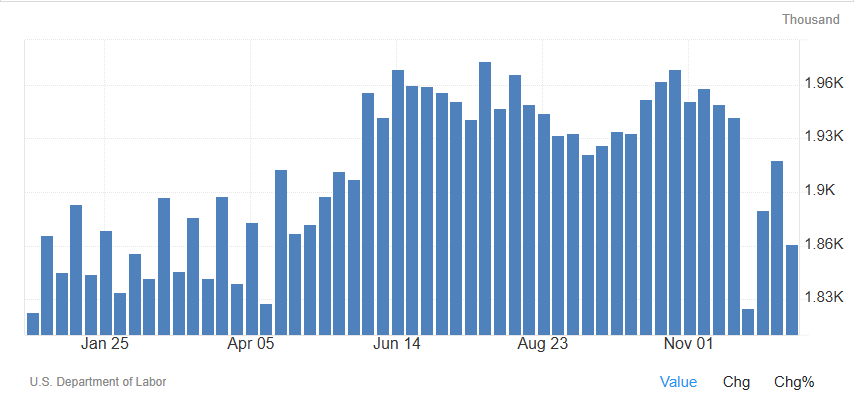 This chart will be the first indicator of a telltale sign that unemployment is increasing. As you see the continuing
jobless claims number rise, it implies the people who lost their jobs are not going back to labor force fast enough
and the unemployment rate is starting to creep higher. Over the last couple of weeks, it has remained roughly flat.
This chart will be the first indicator of a telltale sign that unemployment is increasing. As you see the continuing
jobless claims number rise, it implies the people who lost their jobs are not going back to labor force fast enough
and the unemployment rate is starting to creep higher. Over the last couple of weeks, it has remained roughly flat.
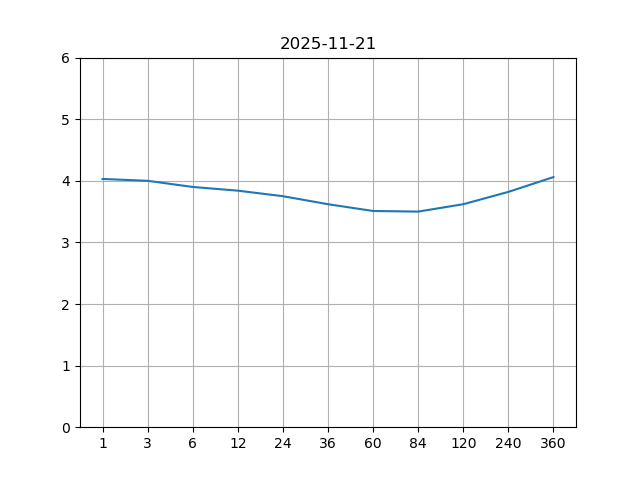 Yield curve - Then
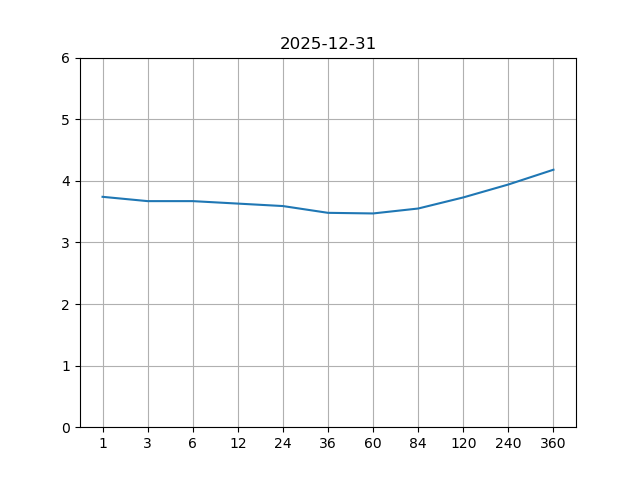 Yield curve - Now
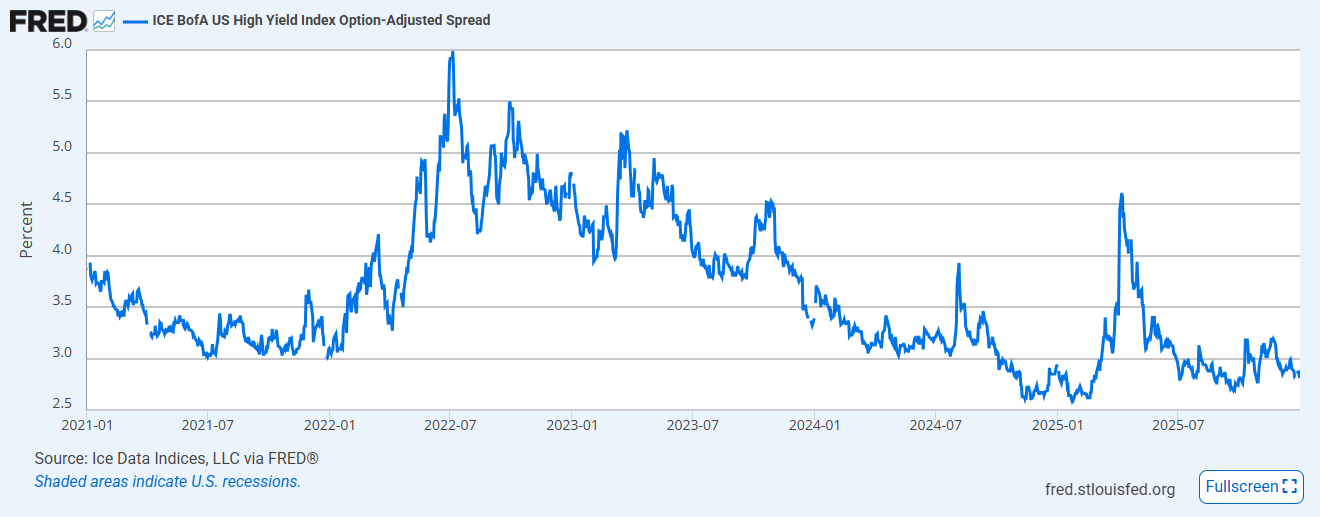
If the economy were to enter a recession, it is likely that some of the companies will struggle to keep up with their debt payments causing their credit spread to widen.
The spread is 2.81% currently.
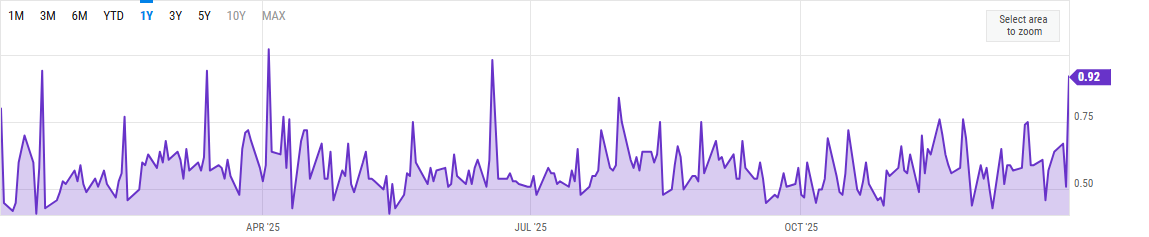
A spike in put / call ratio indicates that investors are very apprehensive about a sudden fall in the equity markets. We are seeing a spike develop as we get closer to the government shutdown in late Jan 2026.
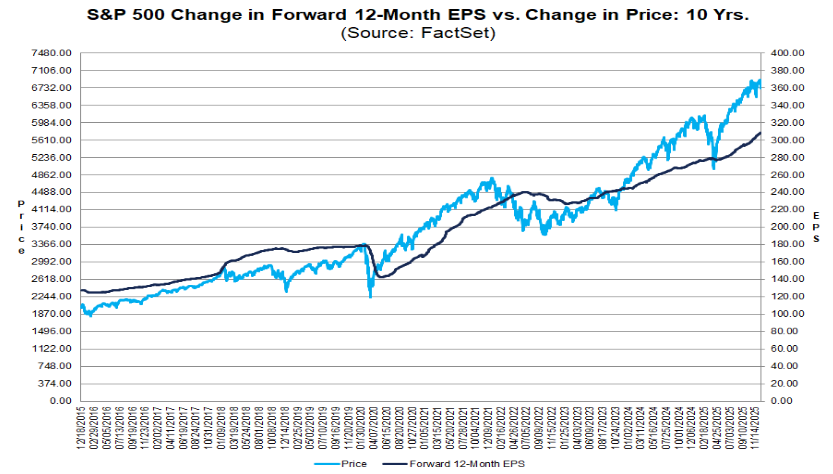
The current earnings forecast by equity analysts estimate the earnings potential for S&P 500 companies to be around $282 which translates to a price to earnings ratio of 21.7 at the current S&P 500 price level. This is above the 5 year and the 10 year averages.
© Copyright Trillium Square Advisors LLC. All rights reserved.