Economic Updates for June 2023
Summary
Potential storms averted but does the coarse look clear?
The conclusion of the debt ceiling debate has cleared out the storm clouds over the markets. Since then, in June, we have seen the markets rally considerably. Not just the top 7 tech stocks, but broadly every sector has seen the benefits. Additionally, the recent inflation data along with FED's pause in interest rate hikes has calmed investor nerves. The money that was parked in money market accounts before the debt ceiling is making its way into the stock market.
How long will the rally continue? While things look great at the moment, really not much has changed from a macroeconomic perspective. We are still in the last innings of the business cycle. The interest rates are over 5% in sharp contrast with the rates just a year ago. Higher interest rates make credit growth difficult. While consumer sentiment is holding up for now, consumers are seeing the strain of higher inflation and higher rates. While employment rates are still pretty strong and demand for labor is strong, there is some softness creeping up in the average weekly hours worked. It appears employers want to retain employees but are reducing the hours worked to save on their costs. We are likely to see earnings decline in Q2 earnings reports. This could set the tone for the markets later in July and August. However, we have been pessimistic about earning decline in the last 3 quarters only to be surprised by the stock market run up as the earnings expectation from analysts has also declined.
It feels as if the recession fear have now been allayed. It could be rekindled as we witness some of the lagged effects of the rising interest rates followed by an earnings decline.
Broad Indicators
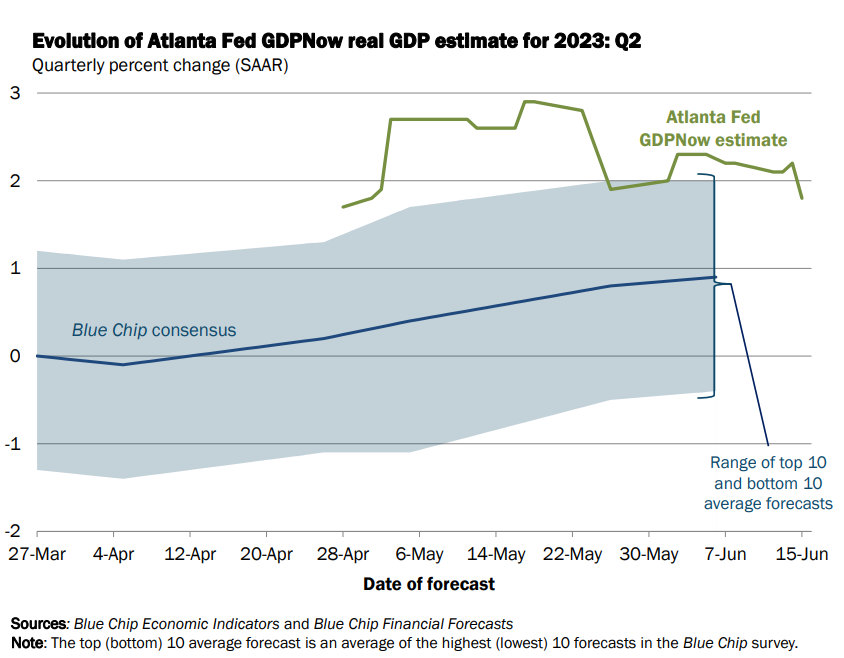
Atlanta GDP NowCast
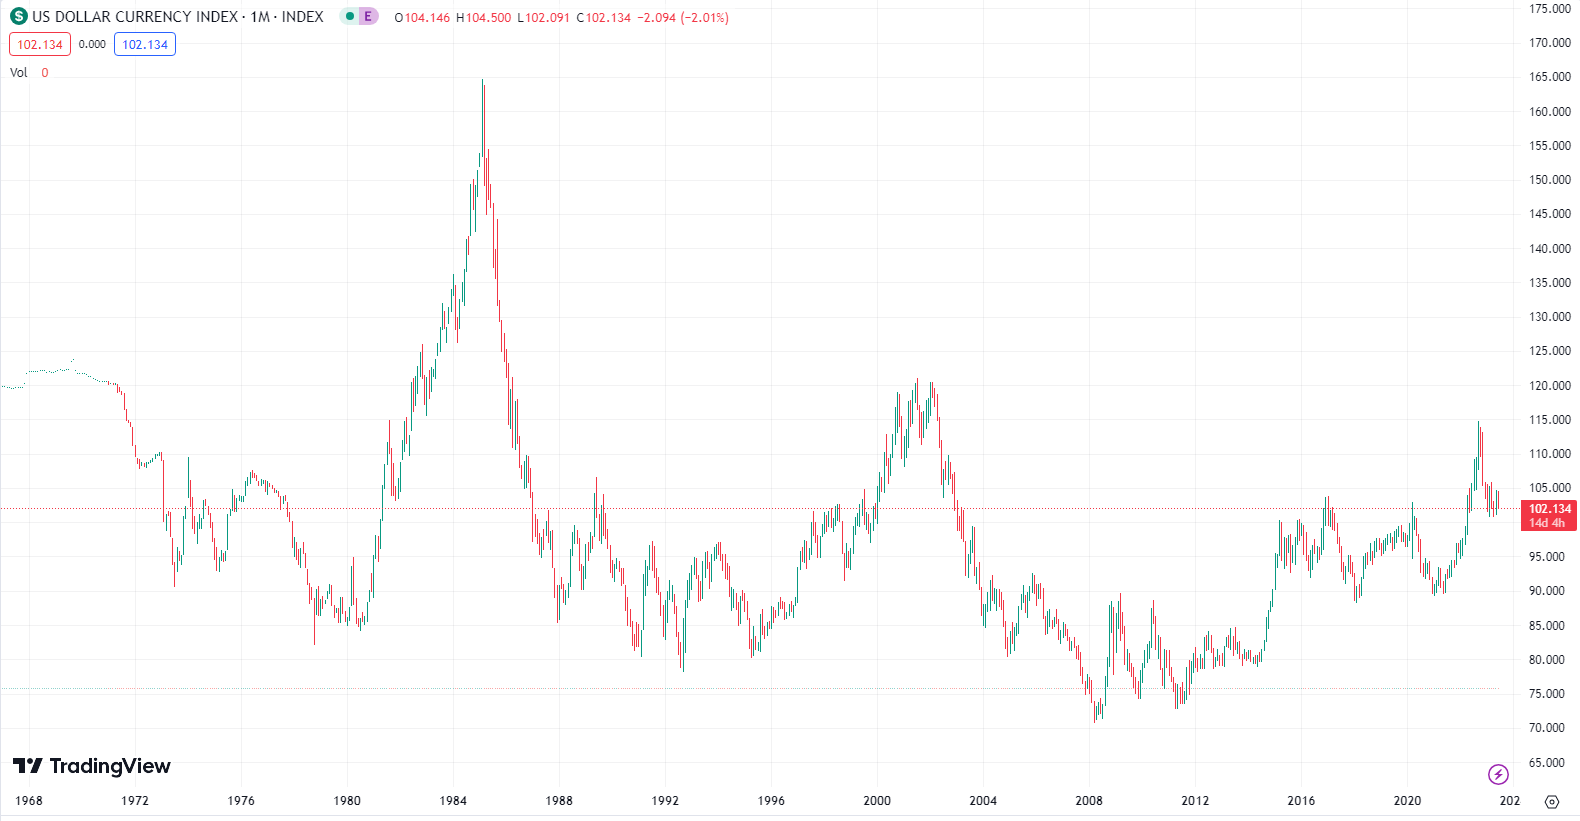
US Dollar Index
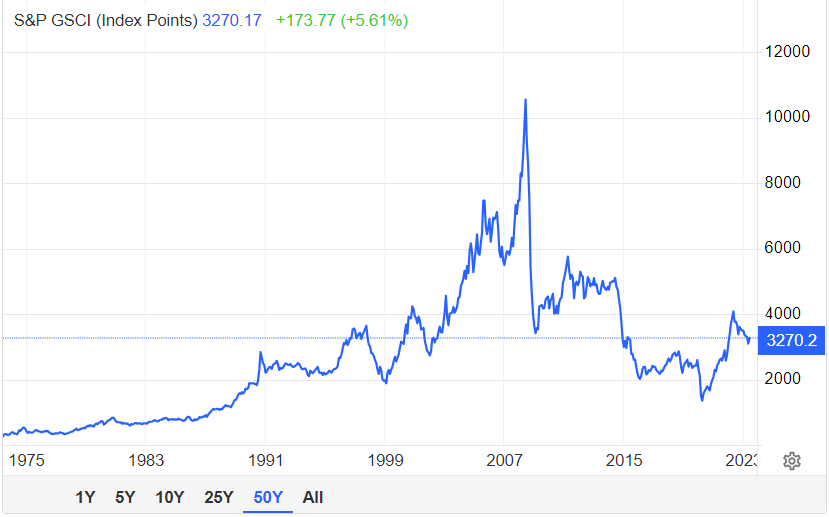
Commodities
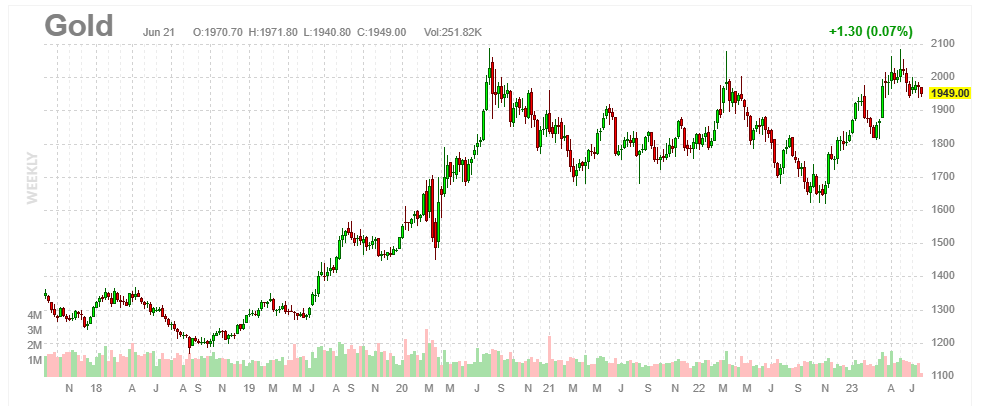
Gold
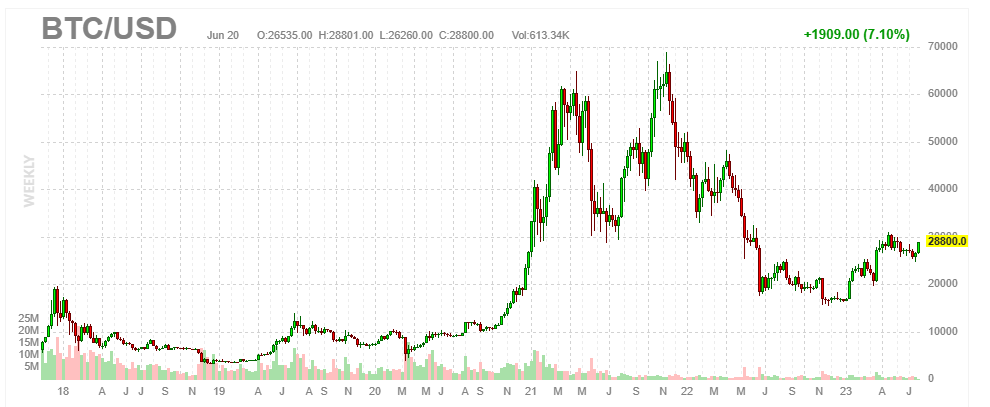
BitCoin
Inflation
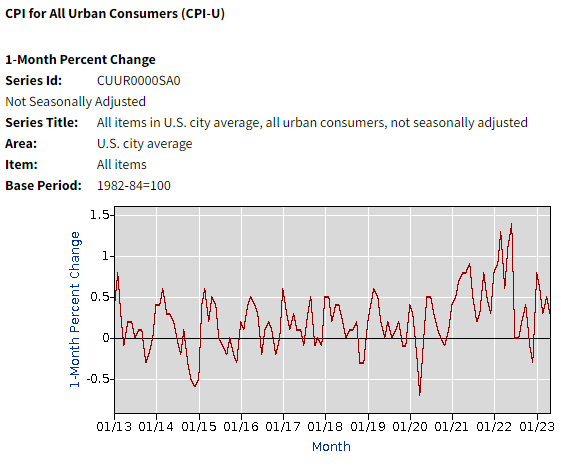
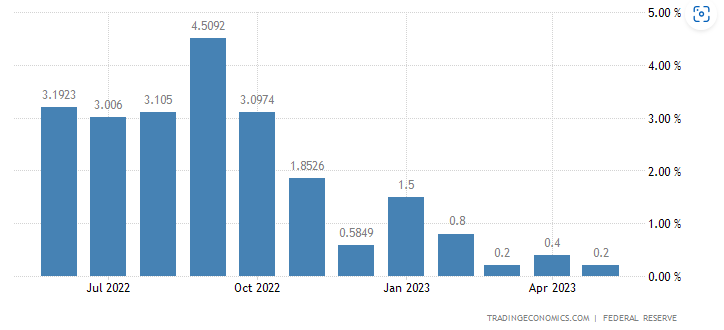
CPI Month over Month
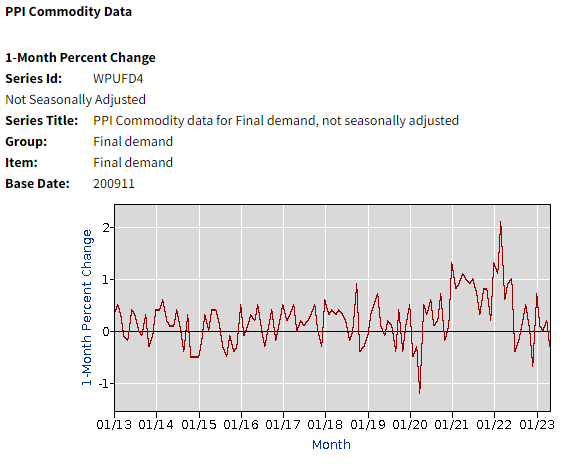
PPI Month over Month
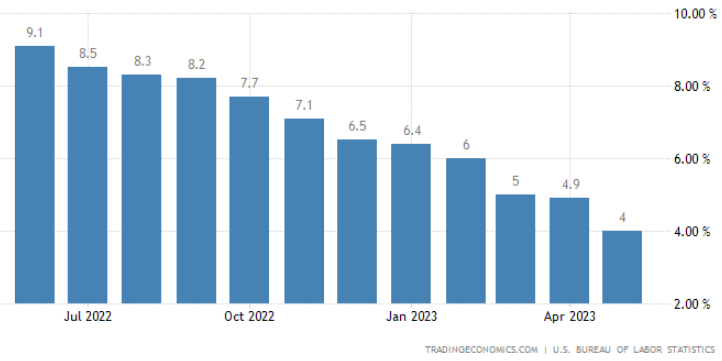
Reported Year over Year Inflation Rate
CPI Components
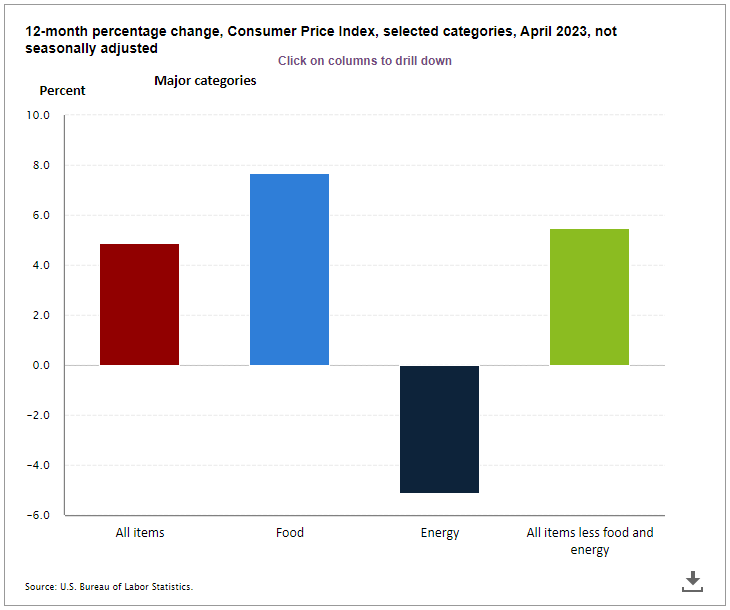 CPI Components Last Month
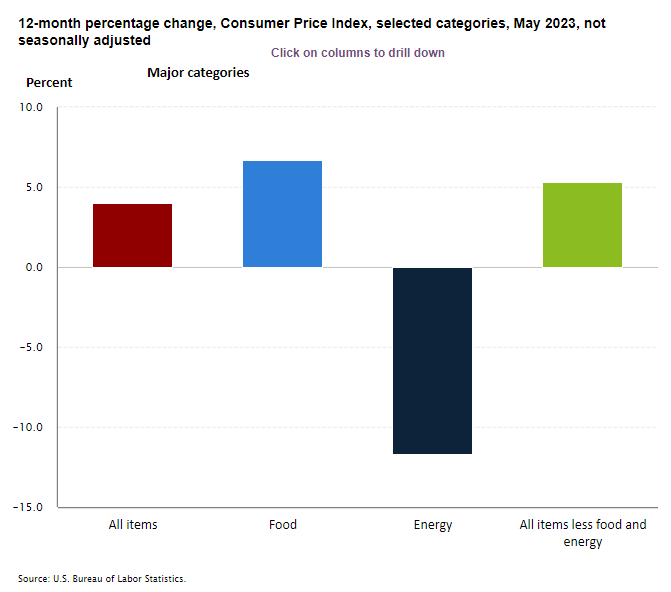 CPI Components This Month
All components of inflation are seen moderating. As mentioned earlier, energy's contribution to inflation is negative three months in a row now! Even food inflation has moderated compared to last month. (Please note that the y-axis in both the graphs have different scales).
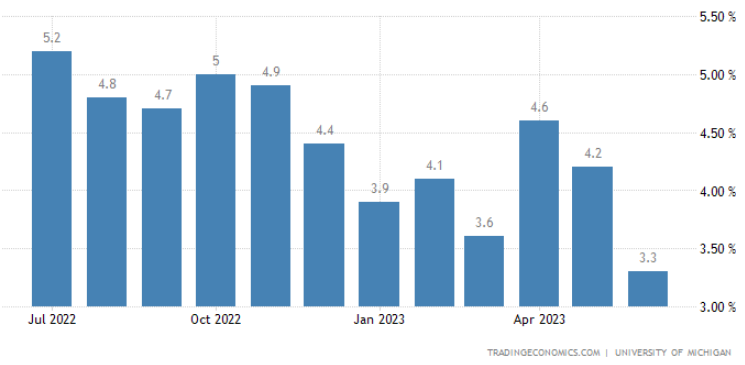
One Year Inflation Expectations
Sentiments
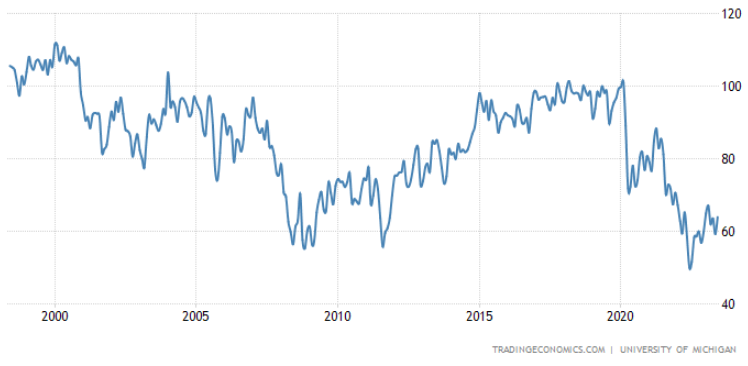
Consumer Sentiments
Investor Sentiments
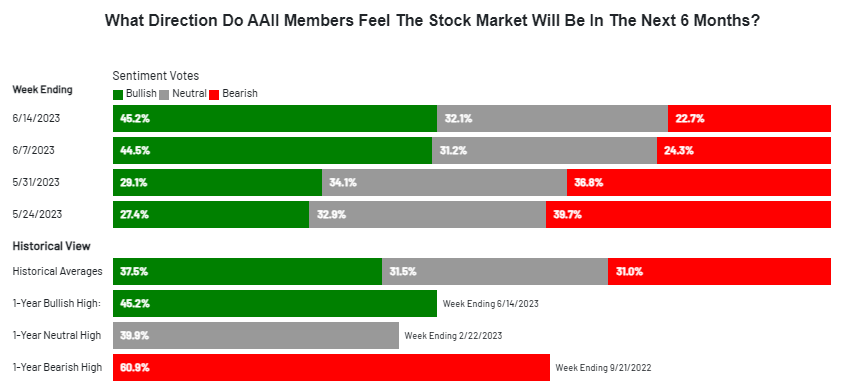
As we expected last month, many of the worries have been resolved. The debt ceiling debate concluded without much volatility. Also, the FED skipped rate hike this month following a mellowing CPI data. On the other hand, the optimism in the job numbers continued. All this has led to the narrow rally in Nasdaq tech stocks to broaden into cyclicals. Certainly, the investors have taken notice and are participating.
The markets are now at the high end of the trading range. The support from here on for continued progress looks dubious. We are still in the late cycle, with high interest rates that puts pressure on credit growth. It would be no surprise if the market takes a pause or a short correction here as the Q2 earnings start pouring in.
GDP Factors
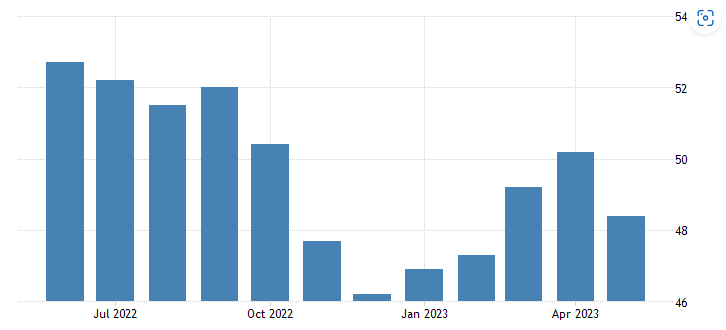
Manufacturing PMI
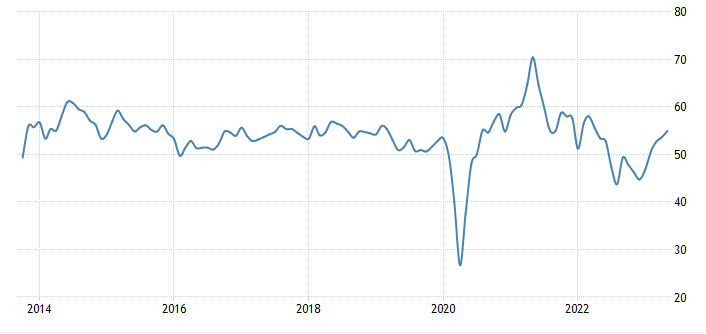
Services PMI
Industrial Production
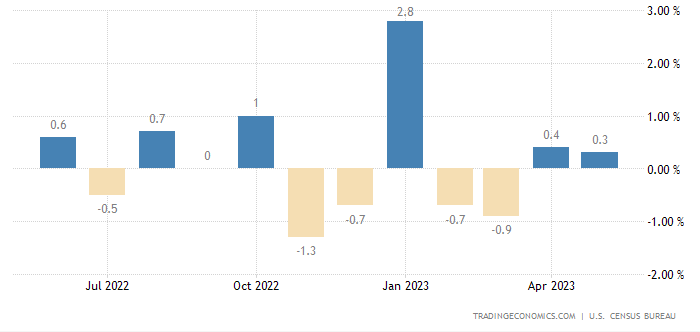
Retail Sales
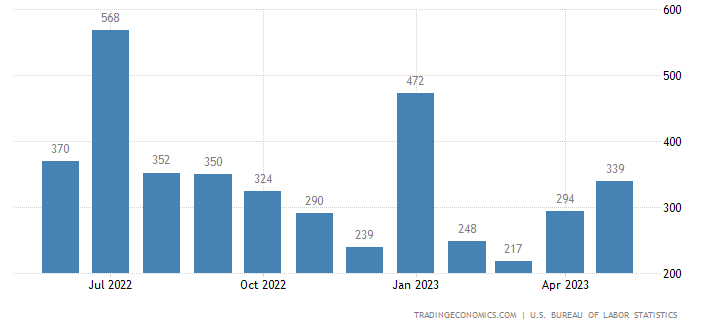
Non-farm Payrolls
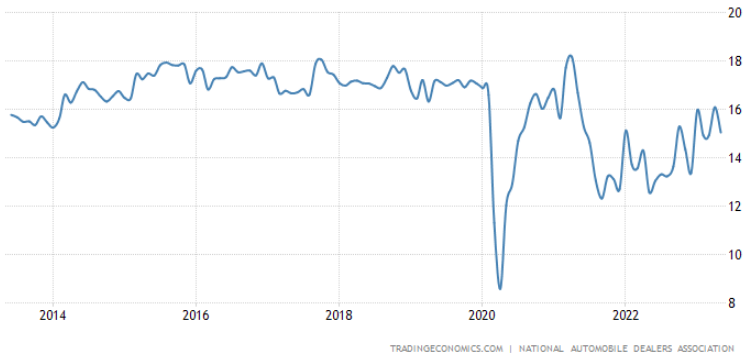
Total Vehicle Sales
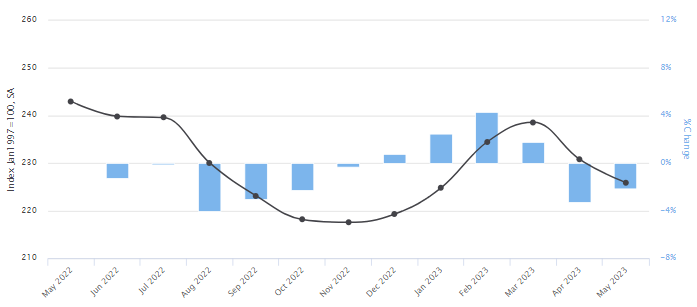
Manheim Used Car Index
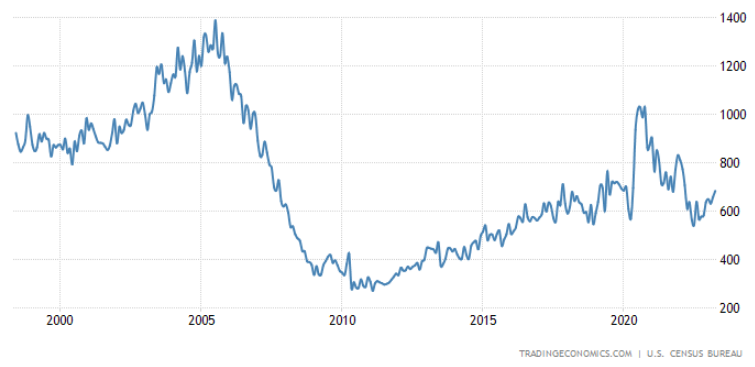
US New Home Sales
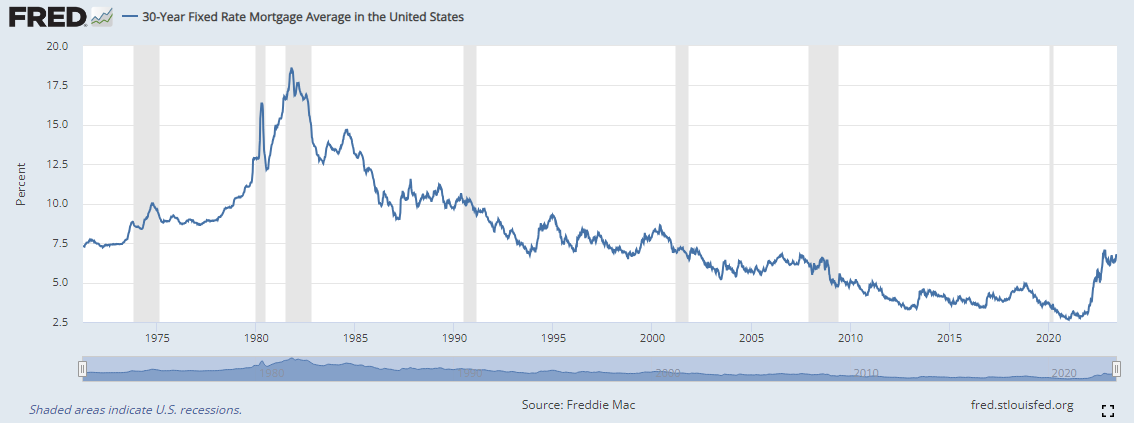
30 Year Fixed Mortgage Rates
The mortgage rates are stabilizing and buyers have been coming back to the market. The housing market is showing signs of not just thawing but even heating up this summer.
While stabilizing, the current rate level at around 7% is causing many families wanting to trade-up, to instead stay put in homes that have mortgages at rates in the low 3% range. This is causing some uncertainty when reading housing activity statistics, as this rise in mortgage rates is the fastest on record, with no exact historic precedent.
Employment Indicators
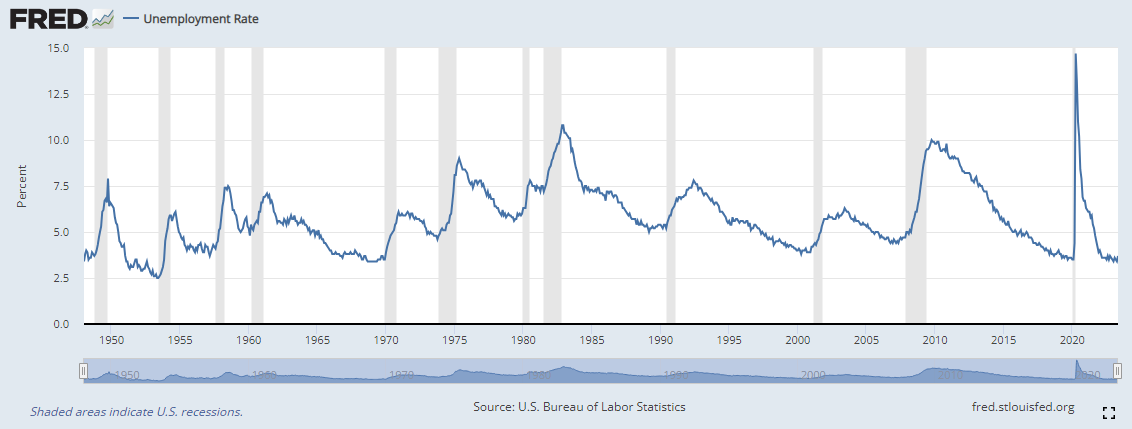
Historical Unemployment Rate
US Jobless Claims
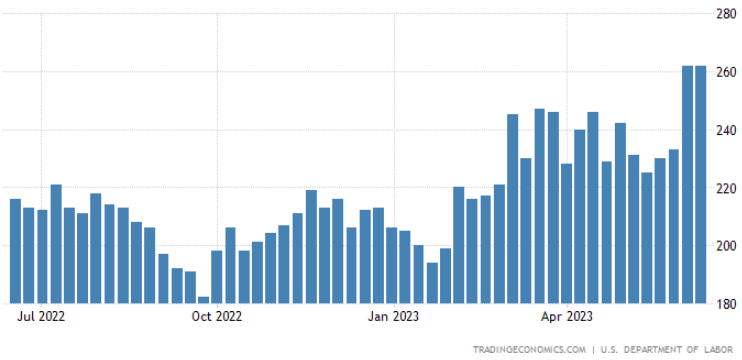
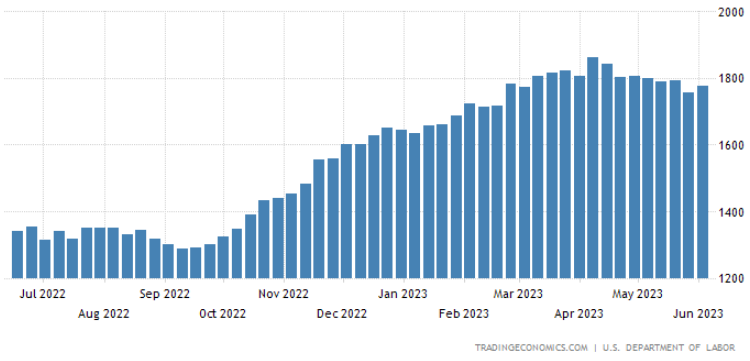 This chart will be the first indicator of a telltale sign that unemployment is increasing. As you see the continuing
jobless claims number rise, it implies the people who lost their jobs are not going back to labor force fast enough
and the unemployment rate is starting to creep higher. Over the last couple of weeks, it has trended lower. Looking at
my LinkedIn feed, I see many starting new positions. Another indicator for soft landing, but it is probably premature to
make that claim with this indicator.
This chart will be the first indicator of a telltale sign that unemployment is increasing. As you see the continuing
jobless claims number rise, it implies the people who lost their jobs are not going back to labor force fast enough
and the unemployment rate is starting to creep higher. Over the last couple of weeks, it has trended lower. Looking at
my LinkedIn feed, I see many starting new positions. Another indicator for soft landing, but it is probably premature to
make that claim with this indicator.
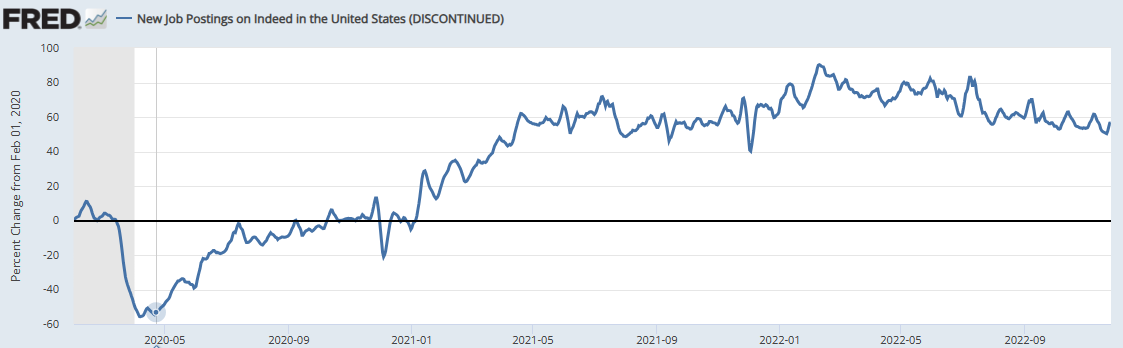
Indeed Job Postings
Wage Growth Tracker
Market Indicators
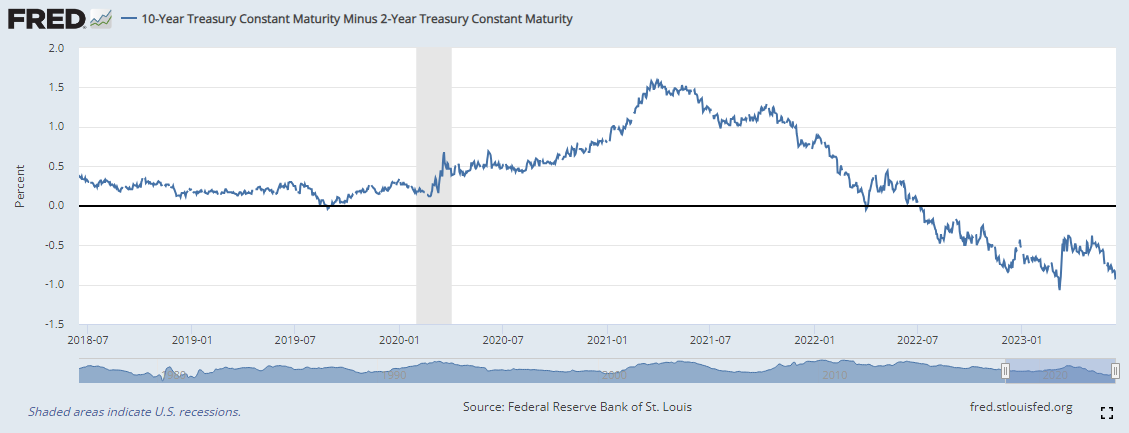
Yield Curve Inversion
Yield Curve - then and now
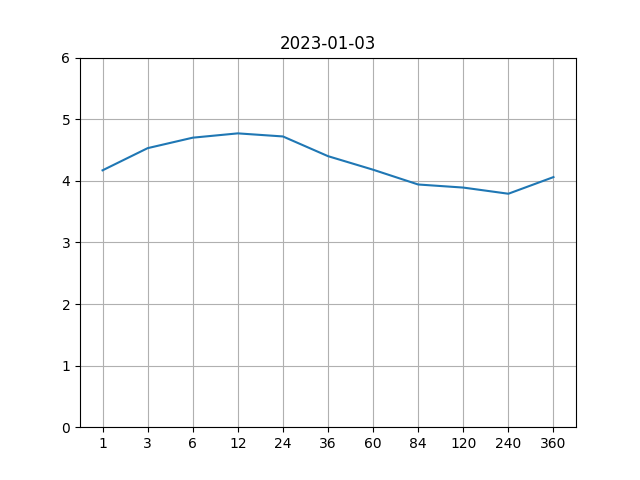 Yield curve - Then
 Yield curve - Now
 The short term rates including the 2year rate is now above 5%!
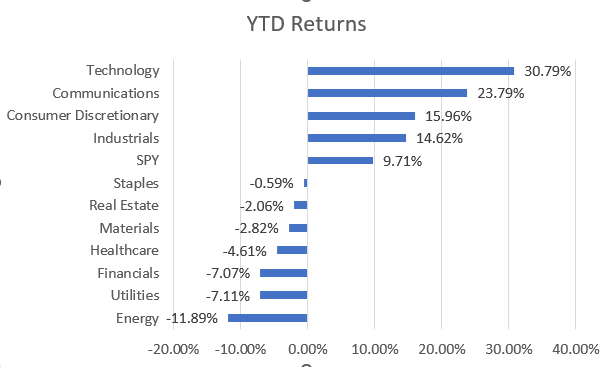
Market Sectors
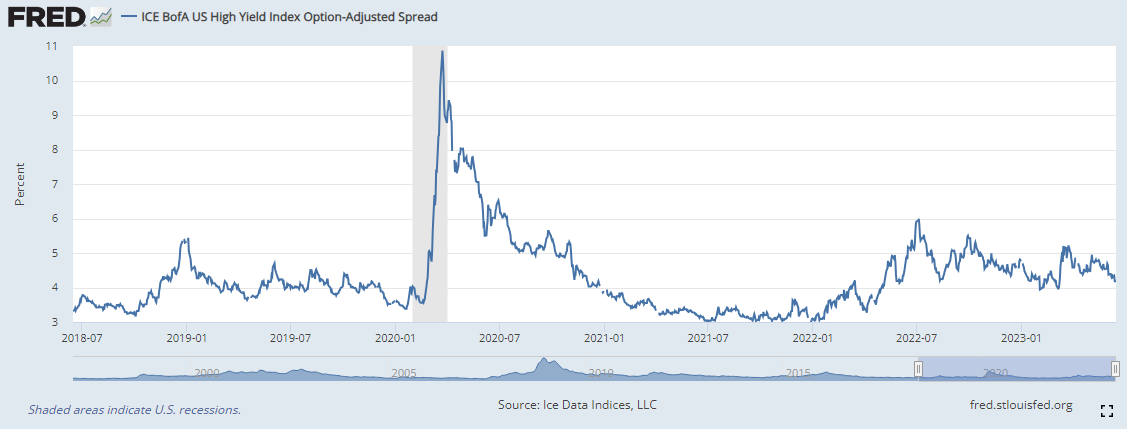
High Yield Index Options-Adjusted Spread
If the economy were to enter a recession, it is likely that some of the companies will struggle to keep up with their debt payments causing their credit spread to widen. This indicator shows how the credit spreads have been behaving so far.
The spreads have been very tame and no observation of spikes in spreads yet indicating a credit crunch. Some market participants are taking the cue from the equity markets to suggest high yield may be getting into risky territory and we may see some spikes fairly soon.
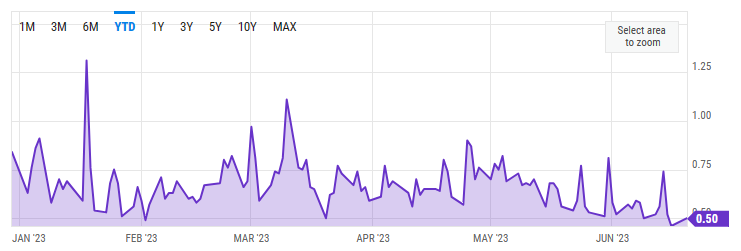
Put Call Ratio
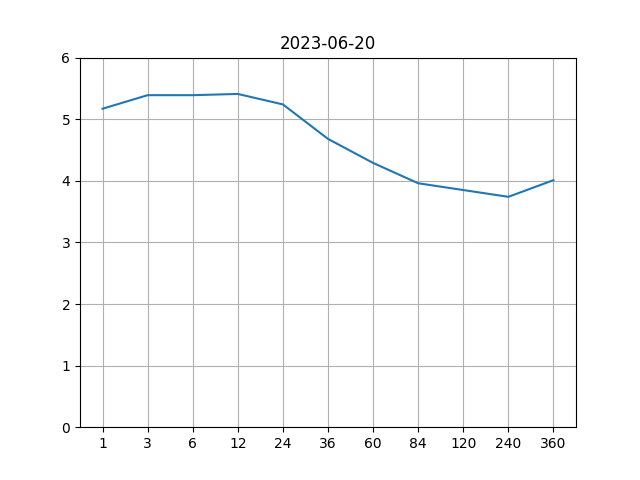
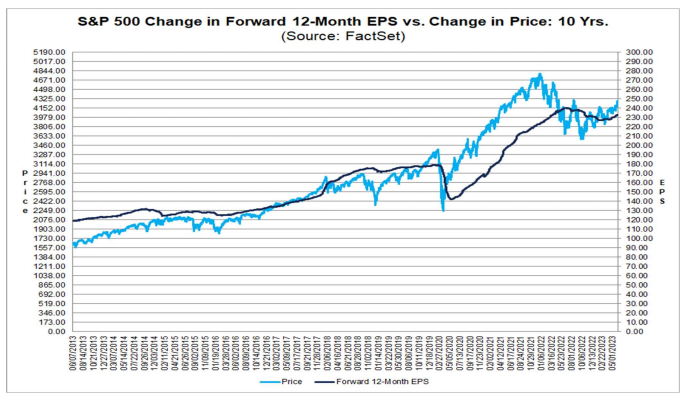
S&P 500 Current Valuations
The current earnings forecast by equity analysts estimate the earnings potential for S&P 500 companies to be around $230 which translates to a price to earnings ratio of 18.5 at the current S&P 500 price level. This is just below the 5 year average and above the 10 year average.
It is likely that as inflation comes down, so will the earnings numbers. This indicates that the future S&P 500 price level could likely come down. Based on the companies that have reported so far, the earnings have declined by -4.8%.
Diclosures
- Trillium Square Advisors LLC is a registered investment adviser offering advisory services in the state of North Carolina and in other jurisdictions where exempted. Registration as an investment adviser does not imply a certain level of skill or training, and the content of this communication has not been approved or verified by the United States Security and Exchange Commission or by any state securities authority.
- Information presented is for educational purposes only and does not intend to make an offer or solicitation for the sale or purchase of any specific securities, investments or investment strategies. Market data, articles and other content in this presentation are based on generally available information and are believed to be reliable. Trillium Square does not guarantee the accuracy of the information contained in this presentation. The information is of a general nature and should not be construed as investment advice and relied upon in making investment decisions.
- Investments involve risk and are never guaranteed. Be sure to first consult with a qualified financial adviser before implementing any strategies discussed herein.
- Past performance is not indicative of future performance.
- The content of this communication and any accompanying documents are not to be copied, excerpted or distributed without express written permission of the firm. Any other use beyond its author’s intent, distribution or copying of the contents of this presentation is strictly prohibited. Nothing in this document is intended to be legal, accounting, or tax advise, and is for informational purposes only.
- Hypothetical performance results have many inherent limitations. No representation is being made that any account will or is likely to achieve profits or losses similar to those shown. In fact, there are frequently sharp differences between hypothetical performance results and the actual results subsequently achieved by any particular investment strategy. Hypothetical performance for illustration purposes only.
- Trillium Square will provide all prospective clients with a copy of our current Form ADV, Part 2A (Disclosure Brochure) upon request. At anytime you can view our current Form ADV, Part 2A at https://adviserinfo.sec.gov