Economic Updates for May 2025
Summary
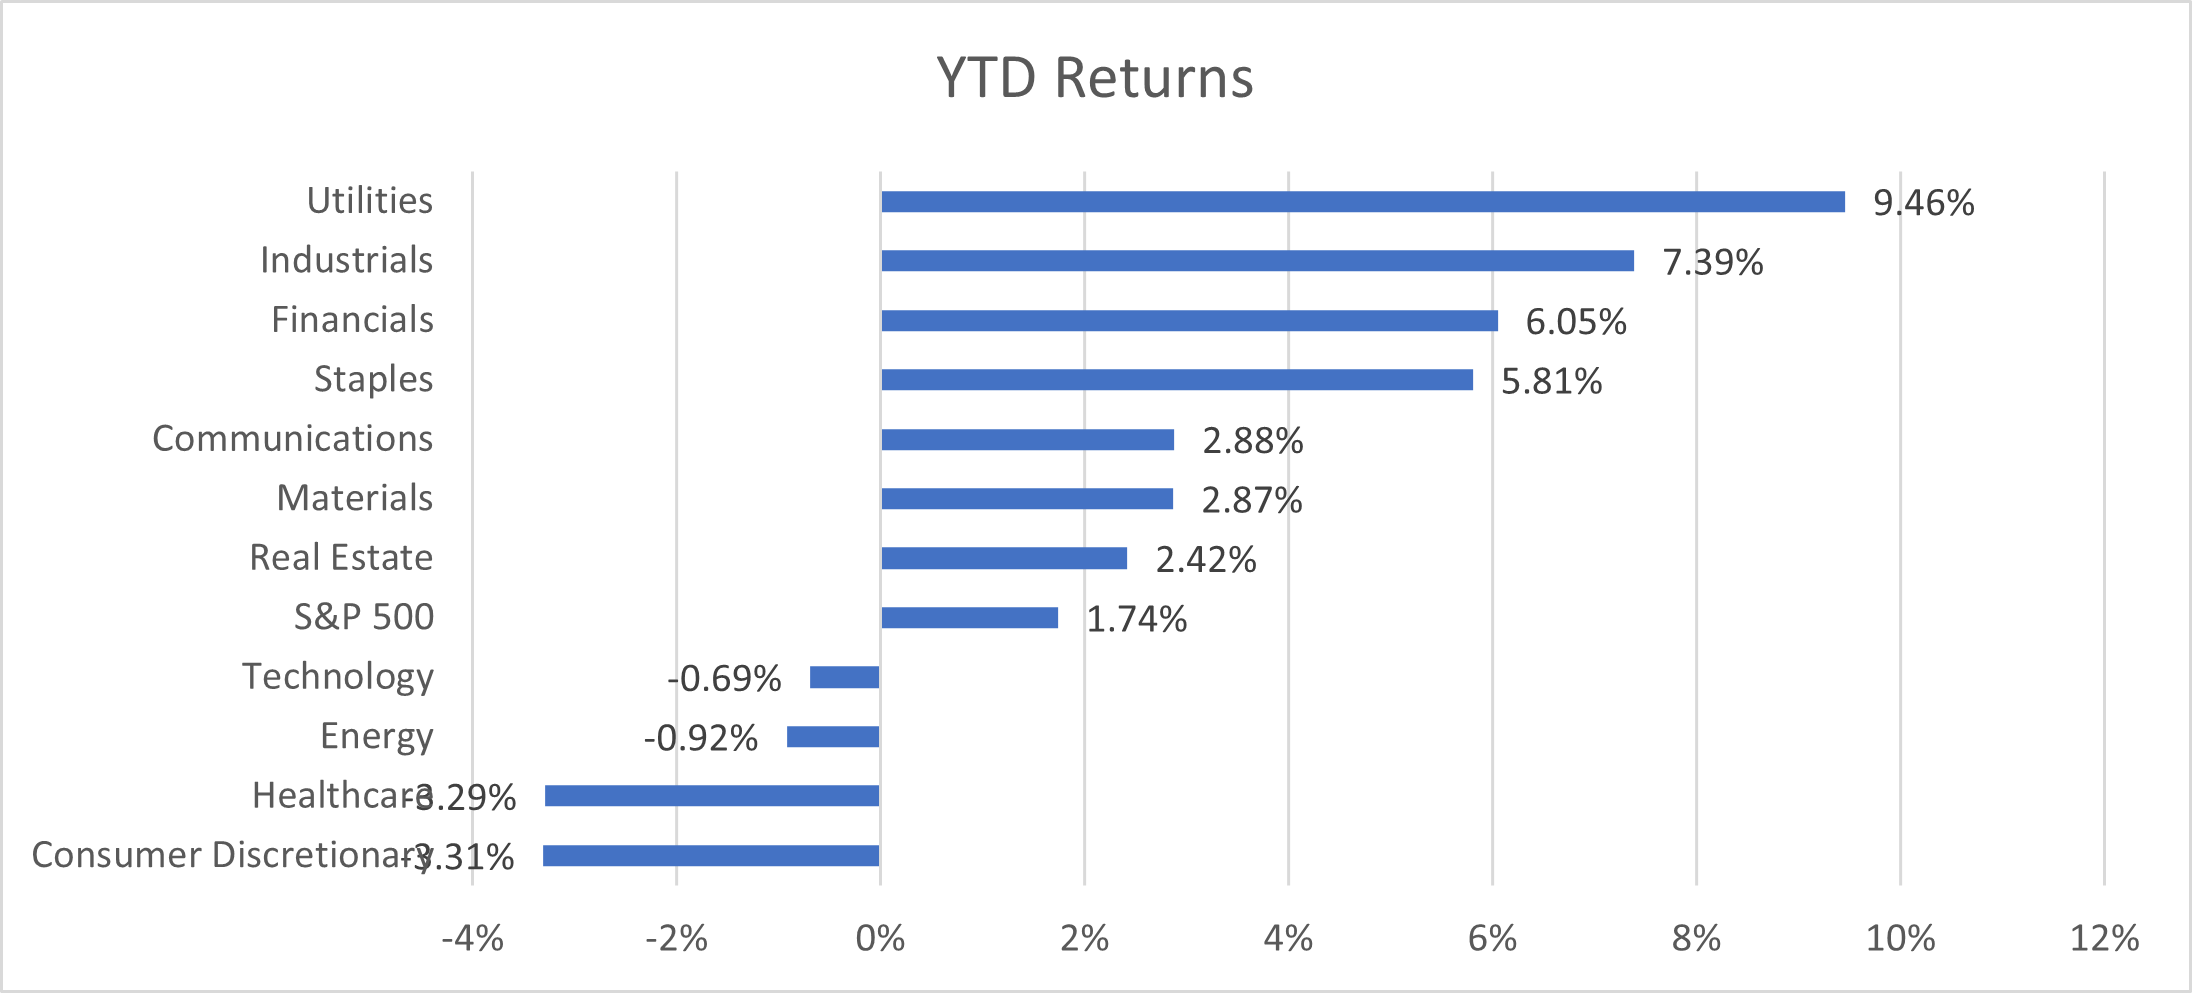
Climbing the Wall of Worry: Markets, Tariffs, and What Comes Next
It has been a wild ride, with the S&P 500 swinging up and down by 20% over the past couple of months. It all began with discussions around tariffs and culminated in the Liberation Day sell-off on April 2nd. As the administration walked back most of the stringent tariffs over the following weeks, the market rebounded, culminating in the deal with China.
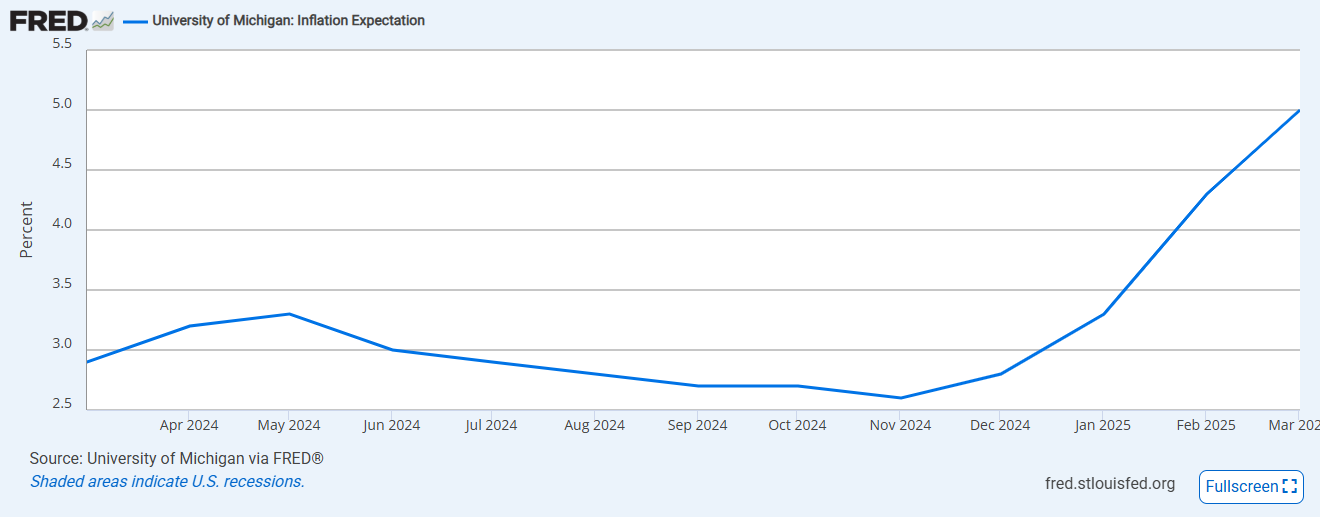
Even so, expectations are that prices for goods will likely rise by double digits. This is evident in surveys and soft data, such as the University of Michigan Consumer Sentiment Index and one-year inflation expectations. The Fed has been patiently waiting to assess the impact of tariffs before taking action, and they are likely to continue waiting unless significant economic damage occurs.
Recently, Moody's Analytics downgraded the rating for U.S. Treasury securities. This did not come as a surprise, as bond yields have been rising modestly in response to the administration's approach to managing the U.S. deficit. The administration is currently working on passing a "big, beautiful bill," which may not meaningfully reduce the deficit. Although the market reaction to the downgrade has been muted so far, it remains an undercurrent in investment decisions globally.
With the market bouncing back into positive territory for the year, it appears we may have avoided an imminent recession. However, as discussed, the soft data is concerning, while the hard economic data is still looking in the rearview mirror. If consumers remain calm and job losses are avoided in the coming months, soft data may normalize. Otherwise, we may see the hard data follow the soft data into recession. The key indicator will be how companies respond to tariffs in the coming months and how inventory builds up for the holiday season.
While economic uncertainty persists, markets continue to climb a wall of worry.
Broad Indicators
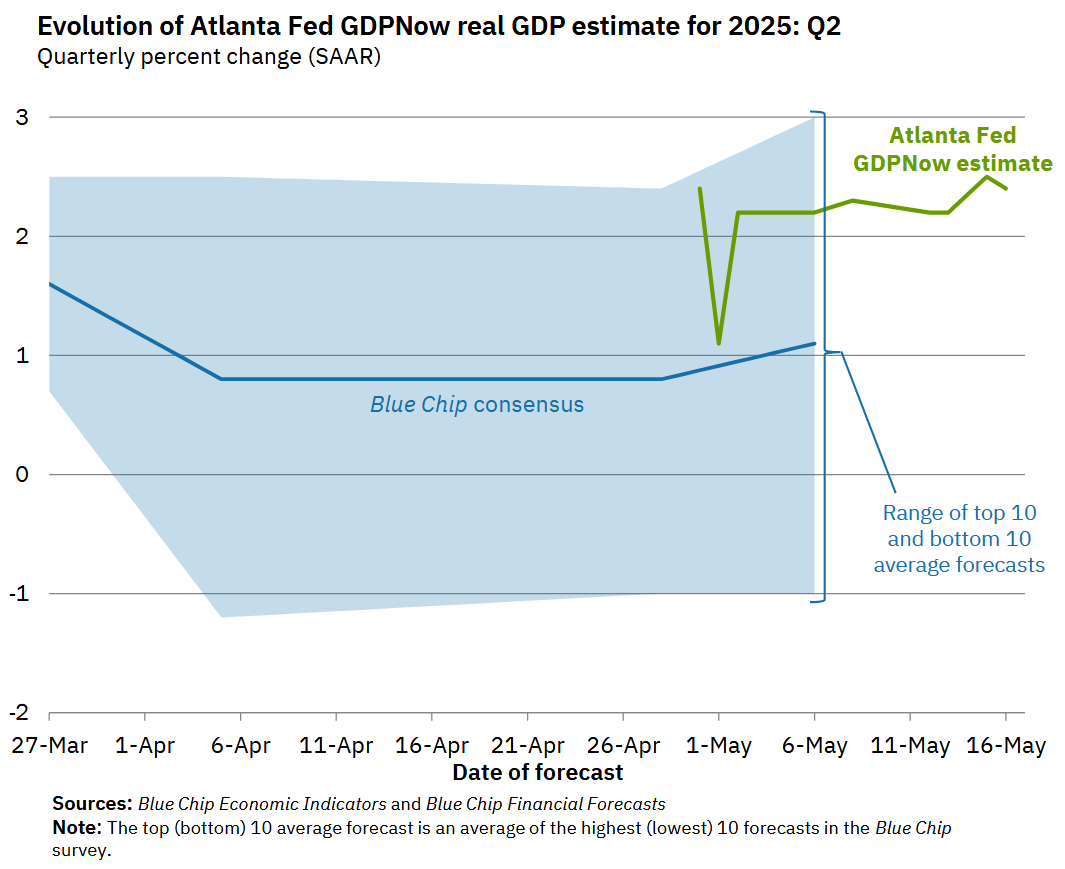
Atlanta GDP NowCast
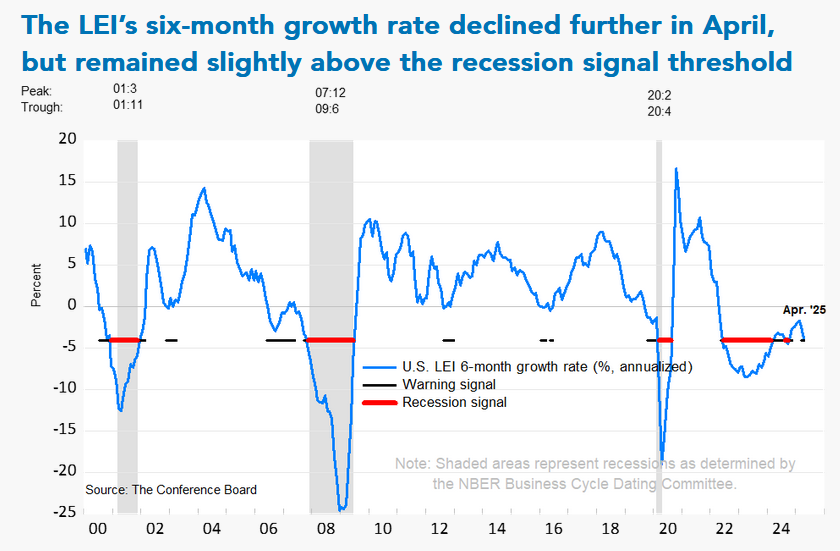
Conference Board's Leading Economic Indicator
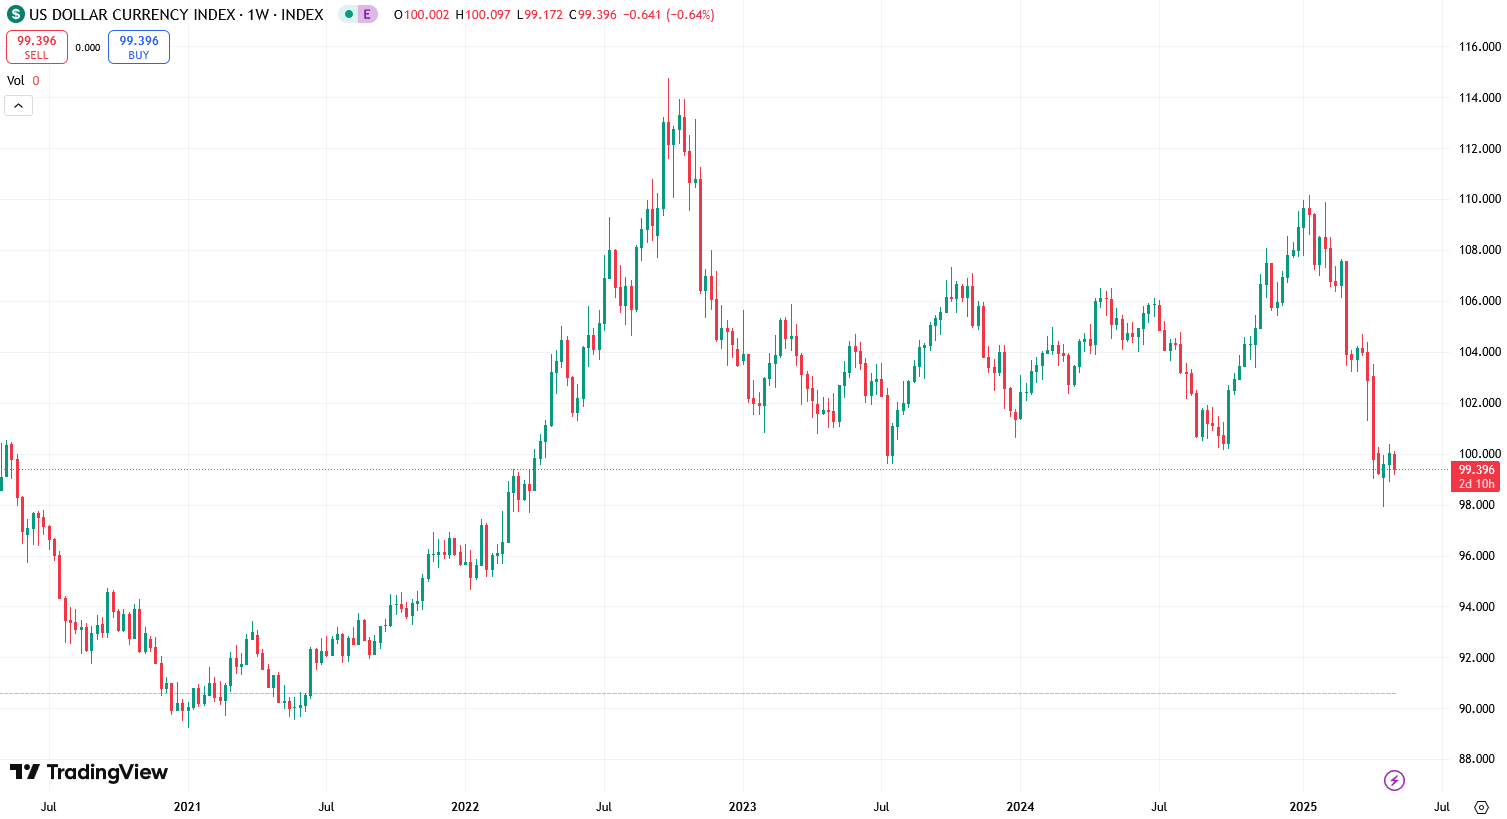
US Dollar Index
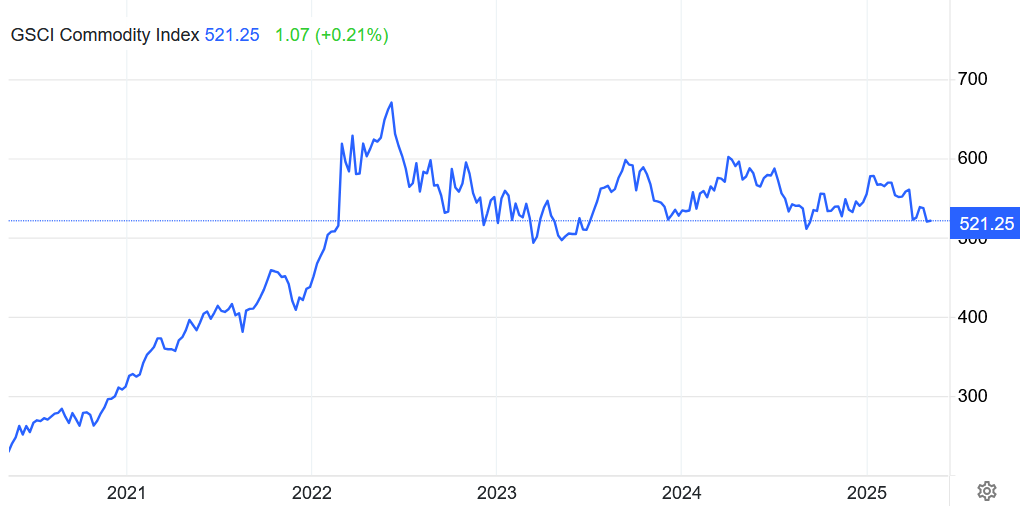
Commodities
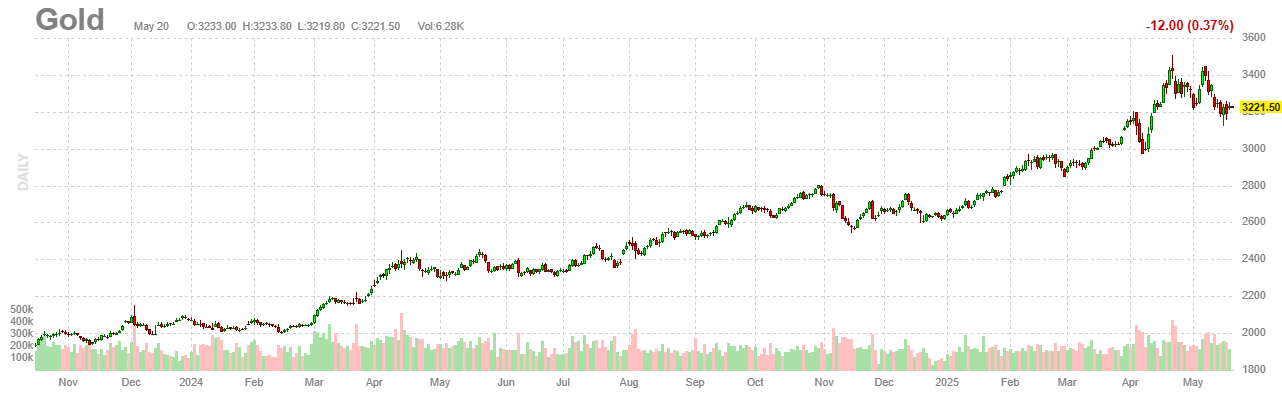
Gold
Gold has rolled over since a deal was made with China on tariffs.
Bitcoin
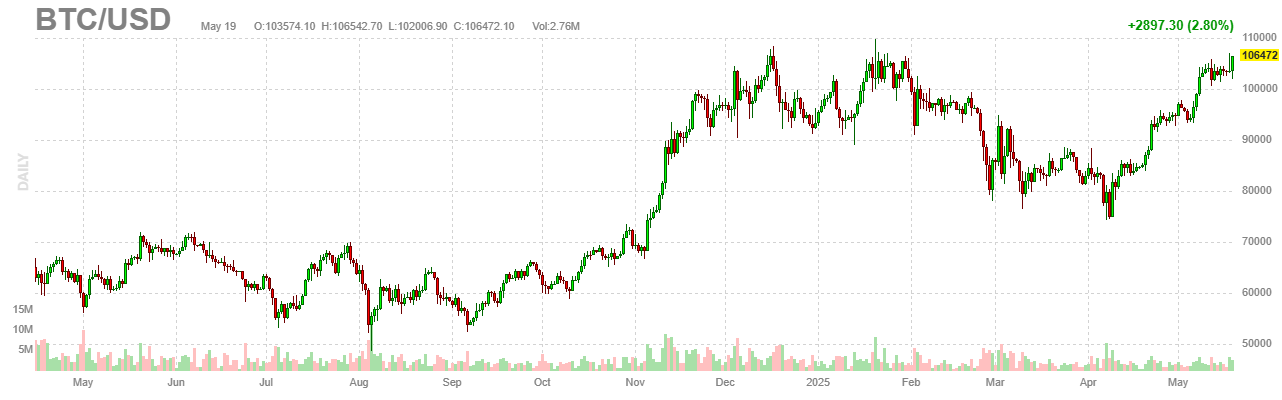
BitCoin continues to behave like a risk asset. It has shot up to its previous all time high since the deal with China on tariffs.
Inflation
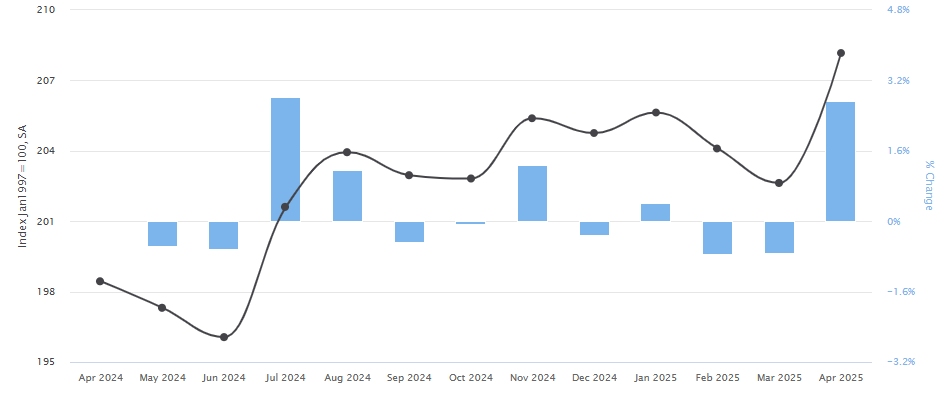
CPI Month over Month
PPI Month over Month
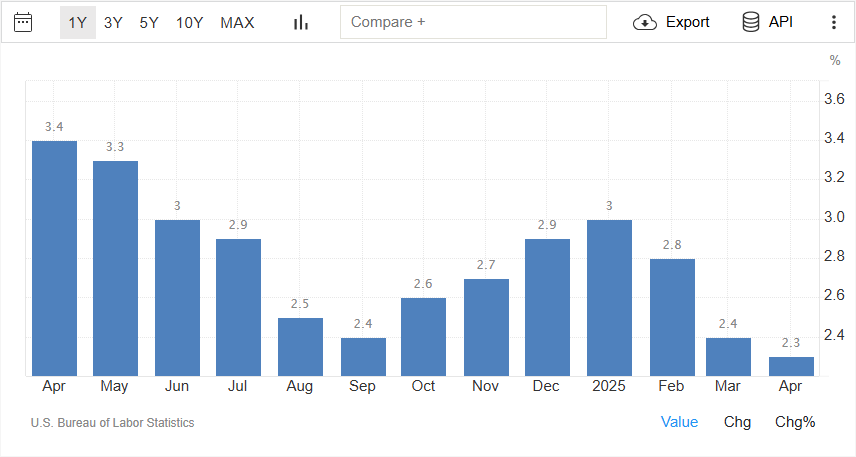
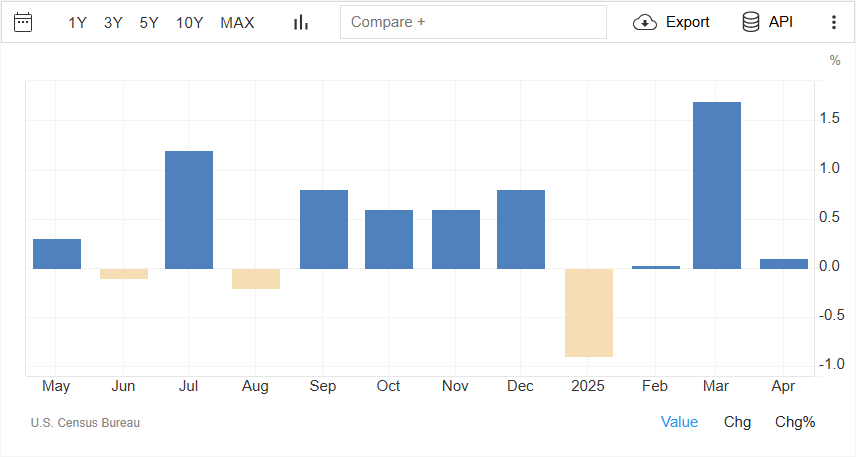
Reported Year over Year Inflation Rate
CPI Components
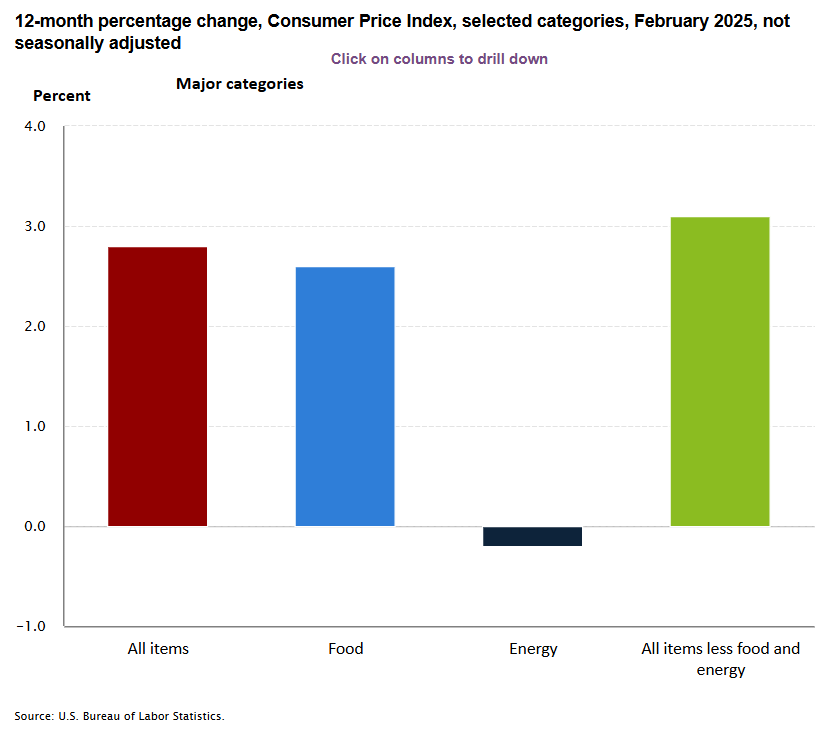 CPI Components Last Month
Source BLS.gov Consumer Price Index
CPI Components Last Month
Source BLS.gov Consumer Price Index
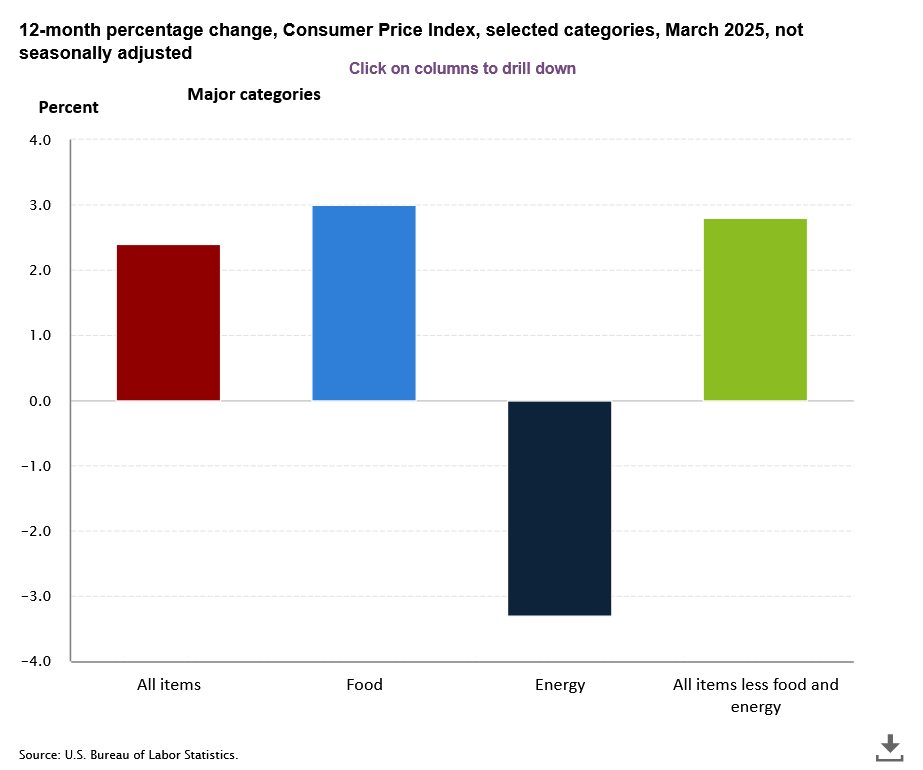 CPI Components This Month
The contributors to the inflation have been mainly food and transportation. The decline in energy prices have helped tame inflation. (Please note that the y-axis in both the graphs have different scales).
One Year Inflation Expectations
Sentiments
Consumer Sentiments

Investor Sentiments
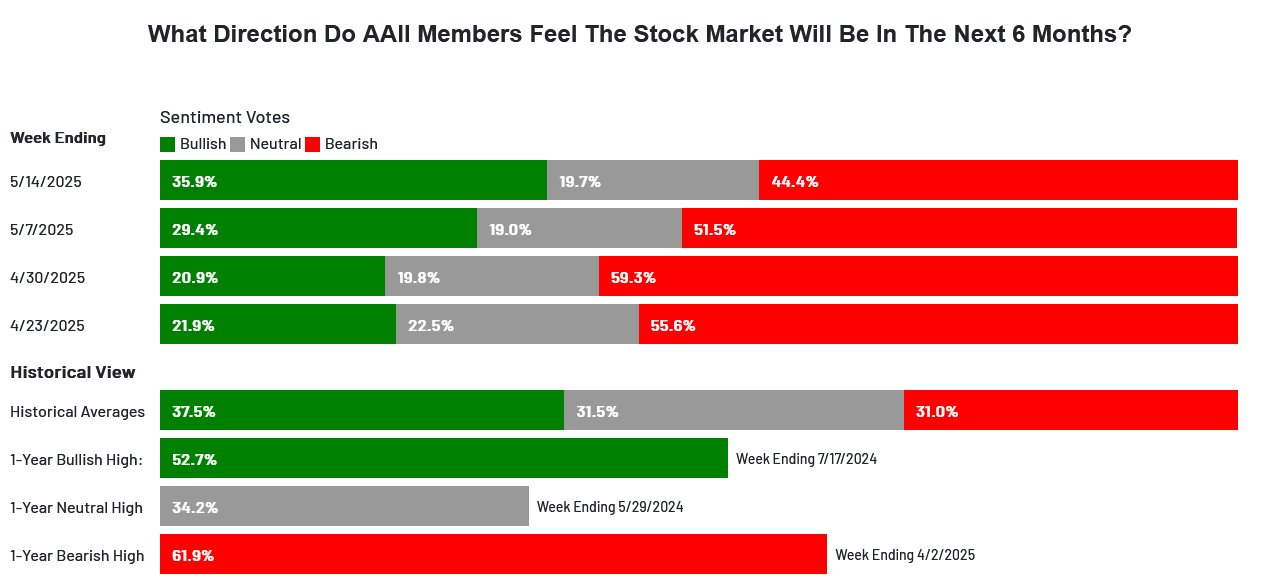
The AAII sentiment has been rebounding from a bearish stance a month ago.
GDP Factors
Manufacturing PMI
Services PMI
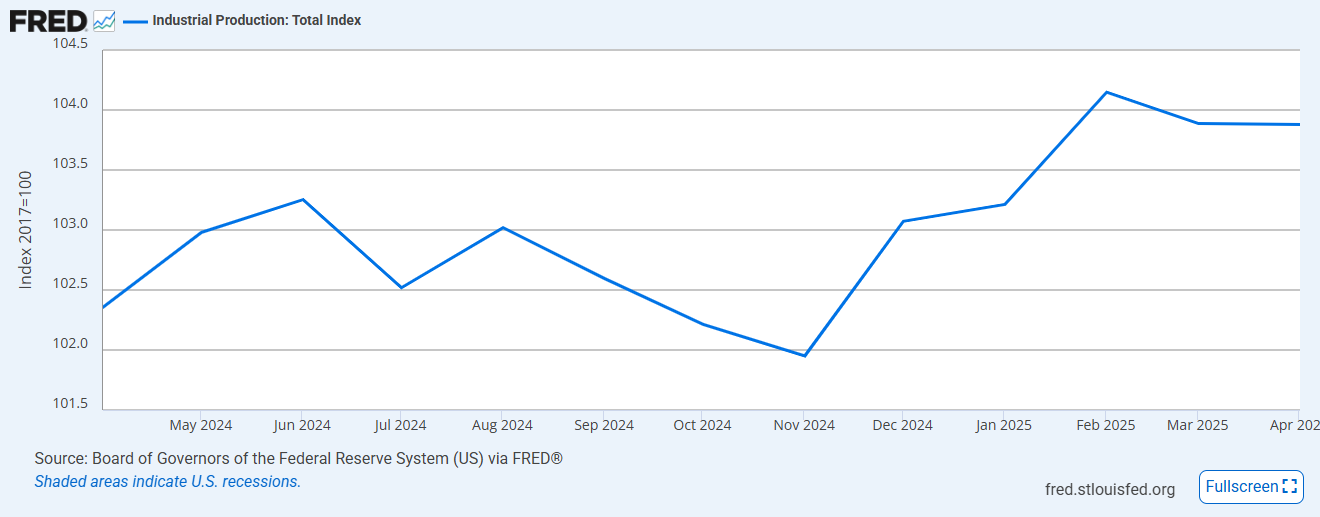
Industrial Production
Retail Sales
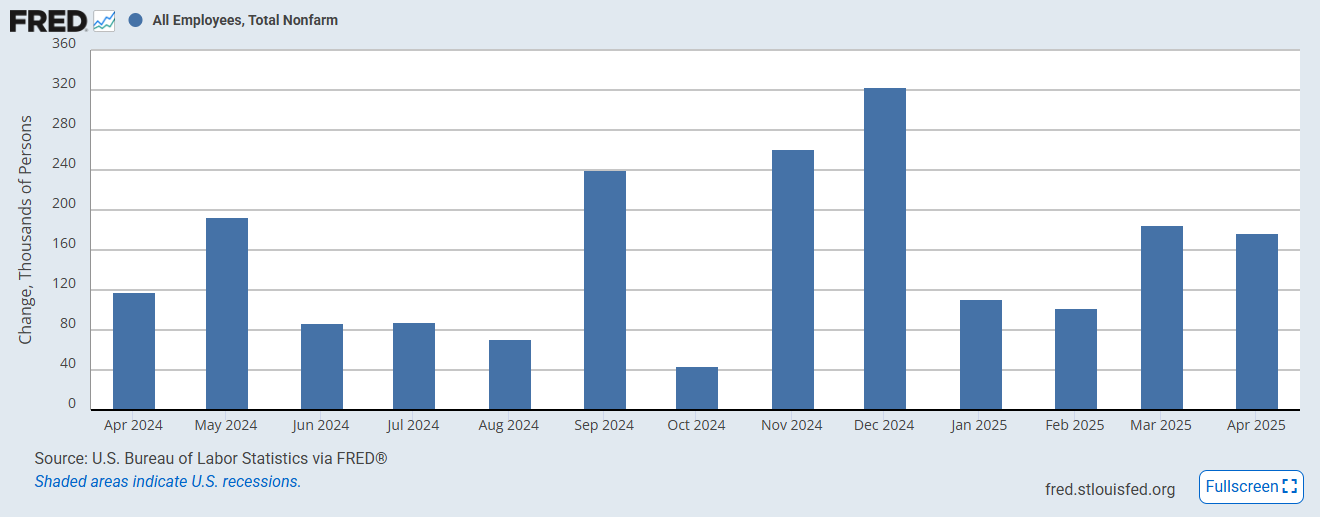
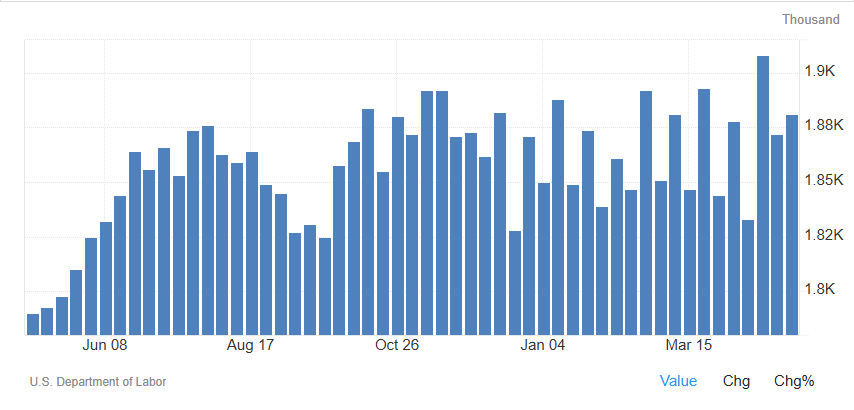
Non-farm Payrolls
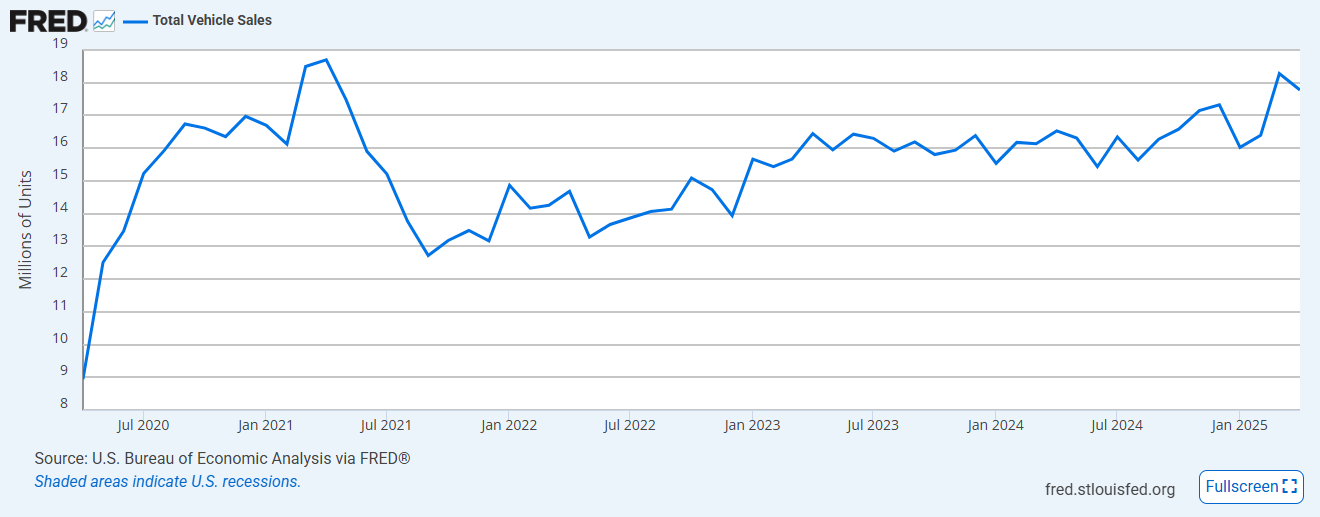
Total Vehicle Sales
Manheim Used Car Index
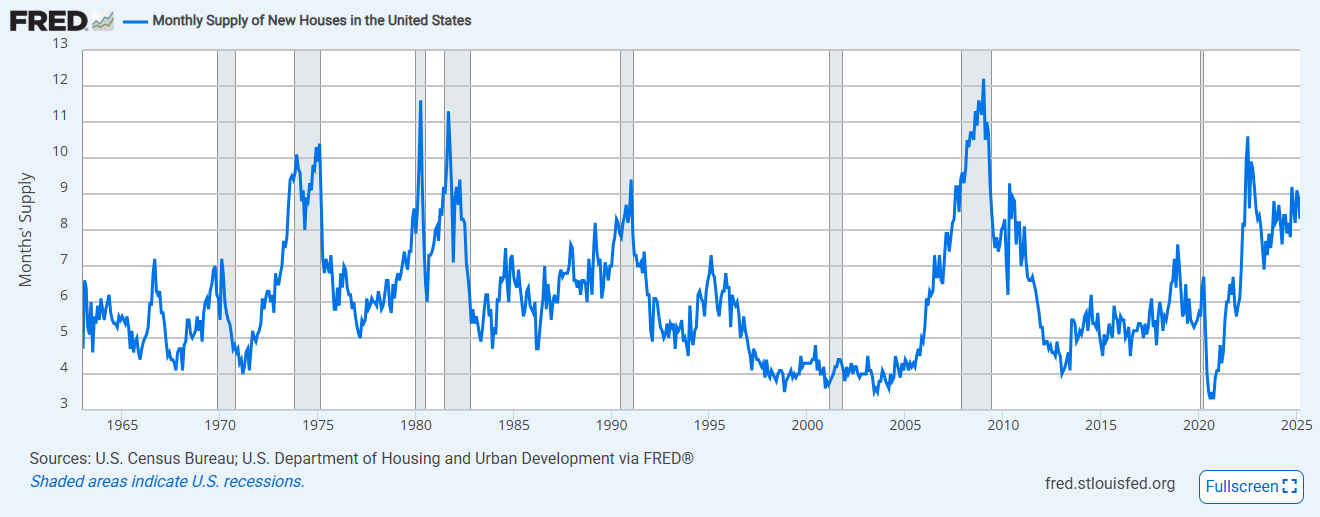
US New Home Sales
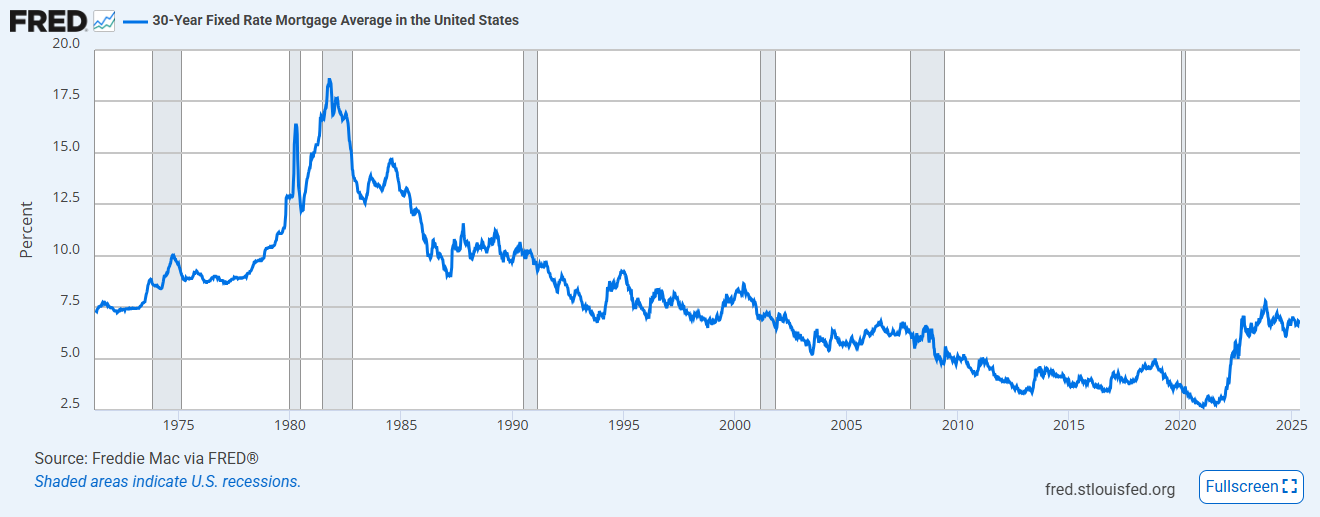
30 Year Fixed Mortgage Rates
The mortgage rates have followed the 10-year Treasury yield lower over the last couple of weeks.
Employment Indicators
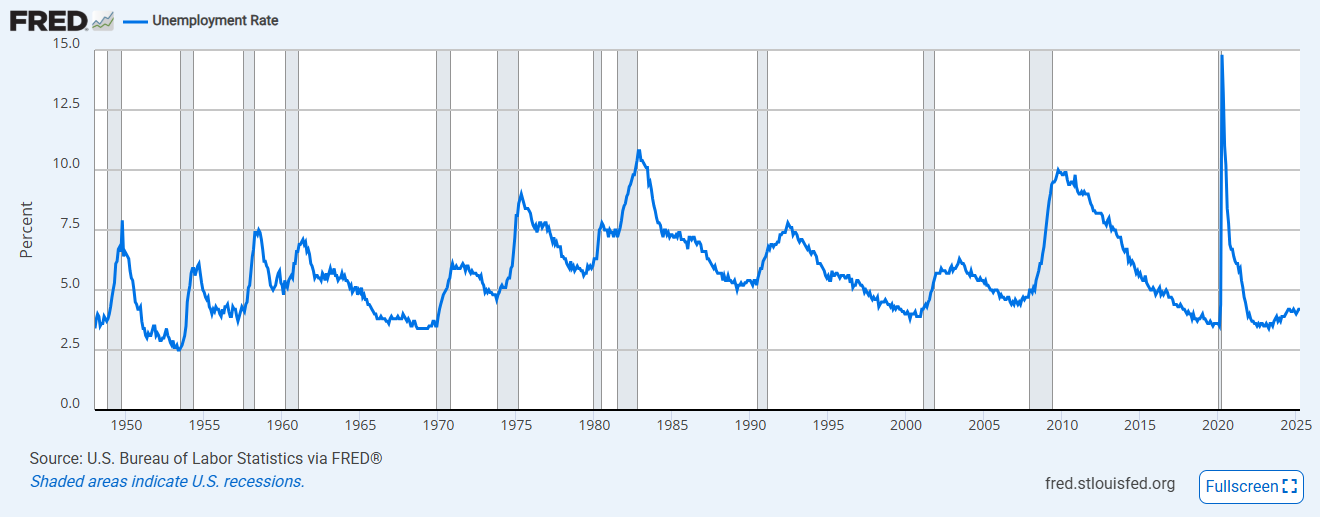
Historical Unemployment Rate
US Jobless Claims
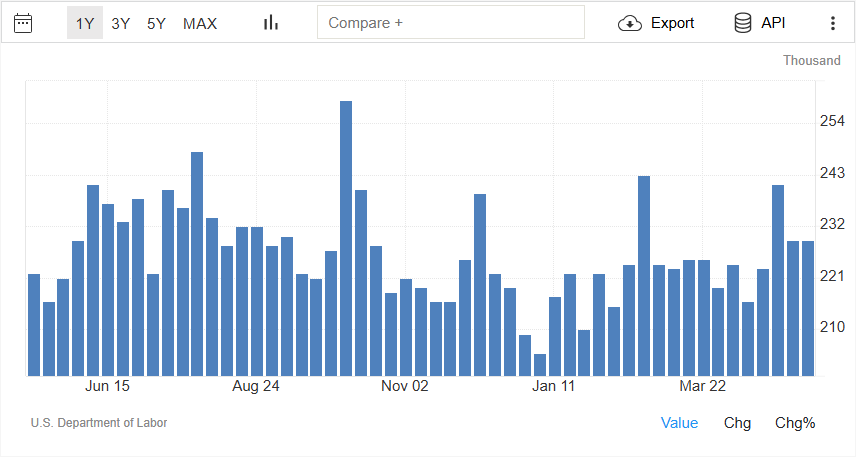
 This chart will be the first indicator of a telltale sign that unemployment is increasing. As you see the continuing
jobless claims number rise, it implies the people who lost their jobs are not going back to labor force fast enough
and the unemployment rate is starting to creep higher. Over the last couple of weeks, it has remained roughly flat.
This chart will be the first indicator of a telltale sign that unemployment is increasing. As you see the continuing
jobless claims number rise, it implies the people who lost their jobs are not going back to labor force fast enough
and the unemployment rate is starting to creep higher. Over the last couple of weeks, it has remained roughly flat.
Market Indicators
Yield Curve Inversion
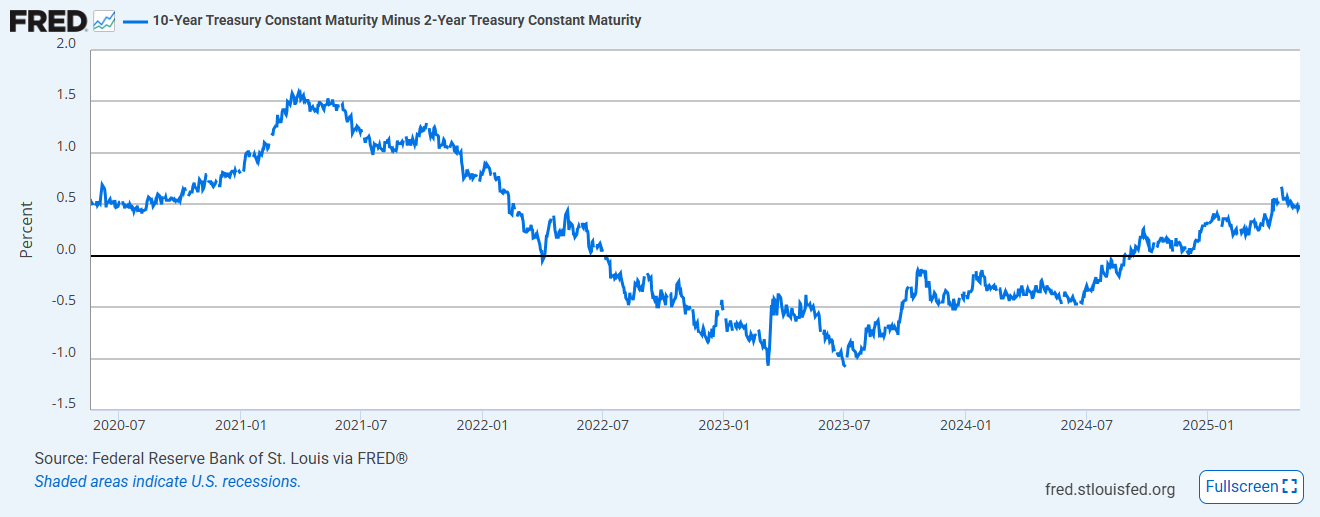
Yield Curve - then and now
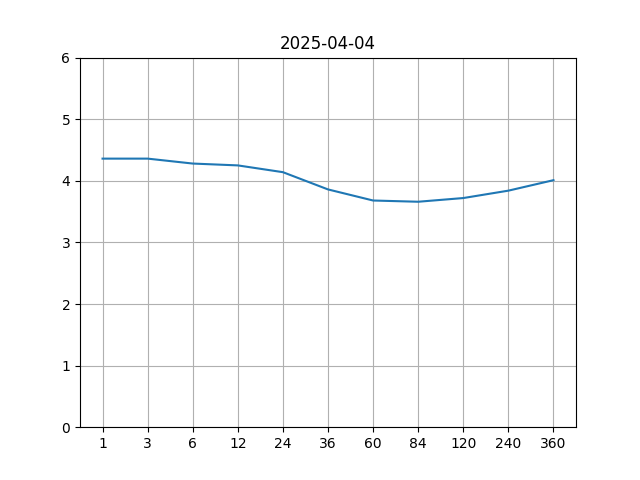 Yield curve - Then
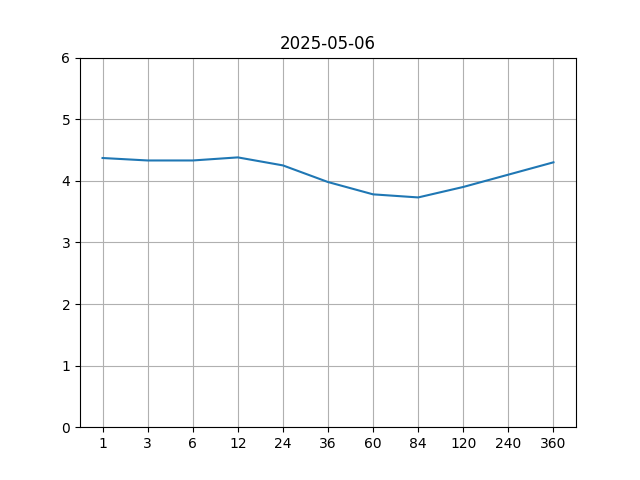 Yield curve - Now
 The yield curve is certainly reverted back to normal. Over the last few weeks, the long end of the rates have edged higher.
Market Sectors
High Yield Index Options-Adjusted Spread
If the economy were to enter a recession, it is likely that some of the companies will struggle to keep up with their debt payments causing their credit spread to widen. This indicator shows how the credit spreads have been behaving well so far even in the face of the Yen carry trade unwind.
The spread is 3.16% currently and sharply rolled over since the April market correction.

Put Call Ratio
A spike in put / call ratio indicates that investors are very apprehensive about a sudden fall in the equity markets. The last spike seen is around April 2nd, liberation day.
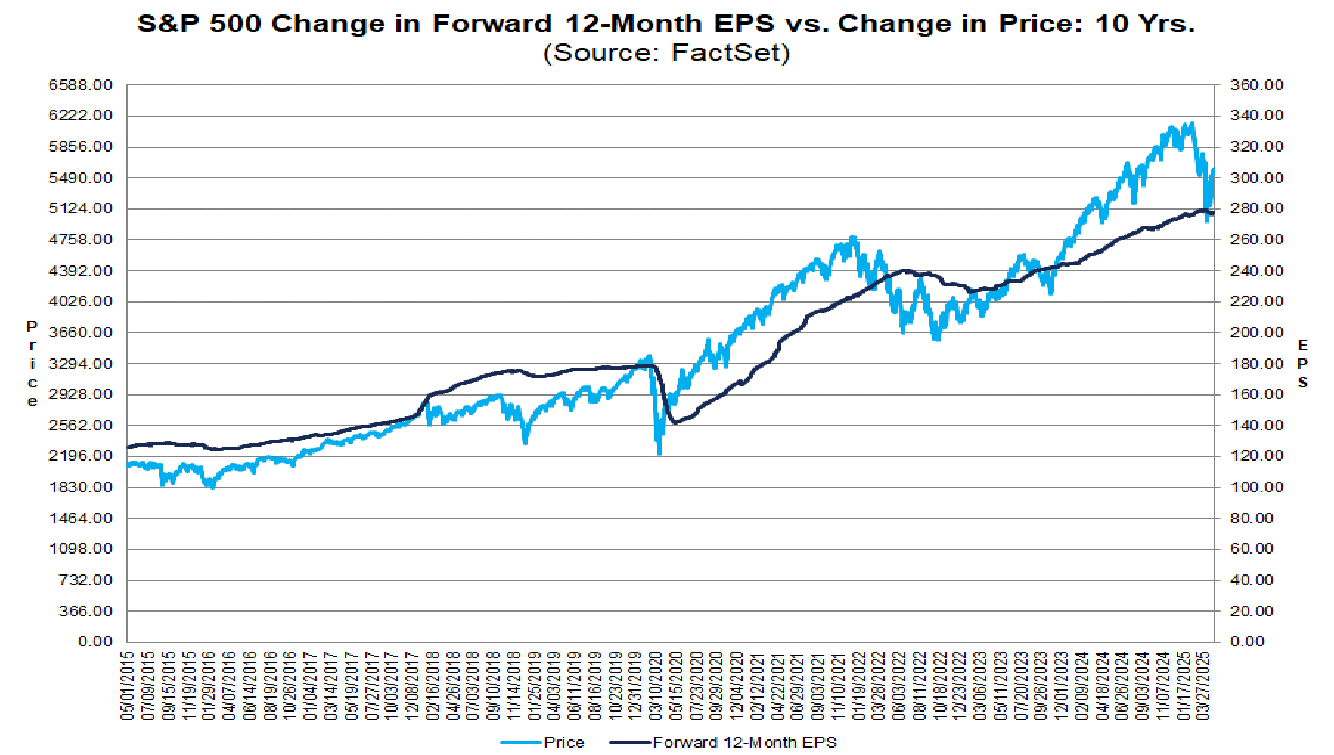
S&P 500 Current Valuations
The current earnings forecast by equity analysts estimate the earnings potential for S&P 500 companies to be around $280 which translates to a price to earnings ratio of 21.4 at the current S&P 500 price level. This is above the 5 year and the 10 year averages. After the tariff tantrum, we have seen some forward guidance being pull by some S&P 500 firms. However, the earning growth has continued to be positive.
Disclosures
- Trillium Square Advisors LLC is a registered investment adviser offering advisory services in the state of North Carolina and in other jurisdictions where exempted. Registration as an investment adviser does not imply a certain level of skill or training, and the content of this communication has not been approved or verified by the United States Security and Exchange Commission or by any state securities authority.
- Information presented is for educational purposes only and does not intend to make an offer or solicitation for the sale or purchase of any specific securities, investments or investment strategies. Market data, articles and other content in this presentation are based on generally available information and are believed to be reliable. Trillium Square does not guarantee the accuracy of the information contained in this presentation. The information is of a general nature and should not be construed as investment advice and relied upon in making investment decisions.
- Investments involve risk and are never guaranteed. Be sure to first consult with a qualified financial adviser before implementing any strategies discussed herein.
- Past performance is not indicative of future performance.
- The content of this communication and any accompanying documents are not to be copied, excerpted or distributed without express written permission of the firm. Any other use beyond its author's intent, distribution or copying of the contents of this presentation is strictly prohibited. Nothing in this document is intended to be legal, accounting, or tax advise, and is for informational purposes only.
- Hypothetical performance results have many inherent limitations. No representation is being made that any account will or is likely to achieve profits or losses similar to those shown. In fact, there are frequently sharp differences between hypothetical performance results and the actual results subsequently achieved by any particular investment strategy. Hypothetical performance for illustration purposes only.
- Trillium Square will provide all prospective clients with a copy of our current Form ADV, Part 2A (Disclosure Brochure) upon request. At anytime you can view our current Form ADV, Part 2A at https://adviserinfo.sec.gov