Summary
Running on fumes - how long can we go before we hit recession?
It has been quite a month! FED very successfully dodged the banking crisis and got away with raising rates one
more time. The market thinks they are likely to raise once again in May.
The short end rates have breached above 5% since our last update and is still rising. The earnings season
for Q1 2023 is in progress and while earnings expectations have been tempered, most companies so far seem to
be able to meet or beat those reduced expectations.
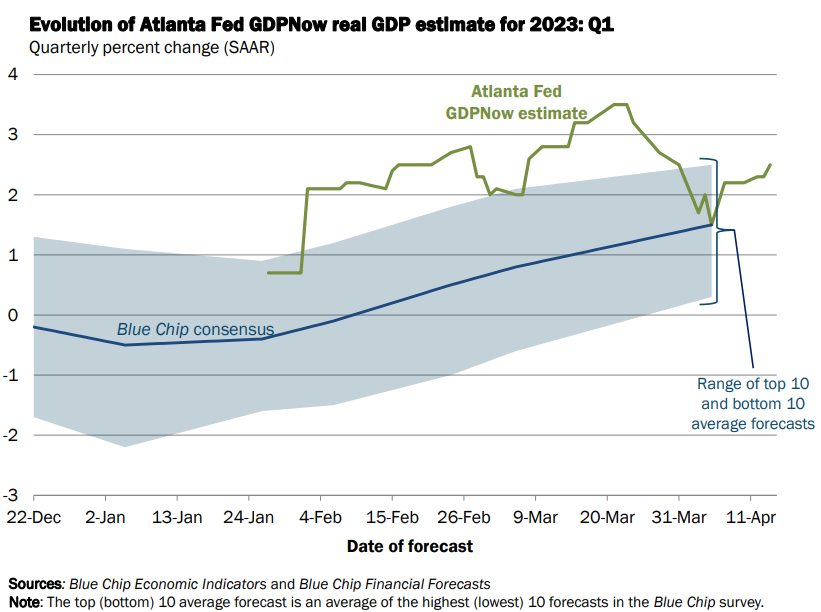
However, none of these indicate continued growth in the coming months / years. In spite of Atlanta FED GDP nowcast
projecting 2+% growth for Q1 2023, the market participants are getting more certain of a hard landing where they
see a recession ahead - in Q3 2023 or latest by Q2 2024. Their conviction is based on the fall in commercial and
industrial loans since the SVB banking crisis. The elevated interest rate takes time to evidence its effects. It is
just a matter of time when credit becomes tight enough to slowdown growth and push unemployment rates higher. FED,
in fact, is projecting that unemployment will rise by about a percentage point by the end of the year. So, we are
running on fumes, and it is just a matter of time before the economy enters a recession.
What if we are wrong and FED is successful in managing a soft or no landing - no recession and the economy
continues to make progress? If so, we expect to see the GDP factors to improve and price to earnings ratio of
equities to rise. While there is some evidence for both, we are still skeptical.
Broad Indicators
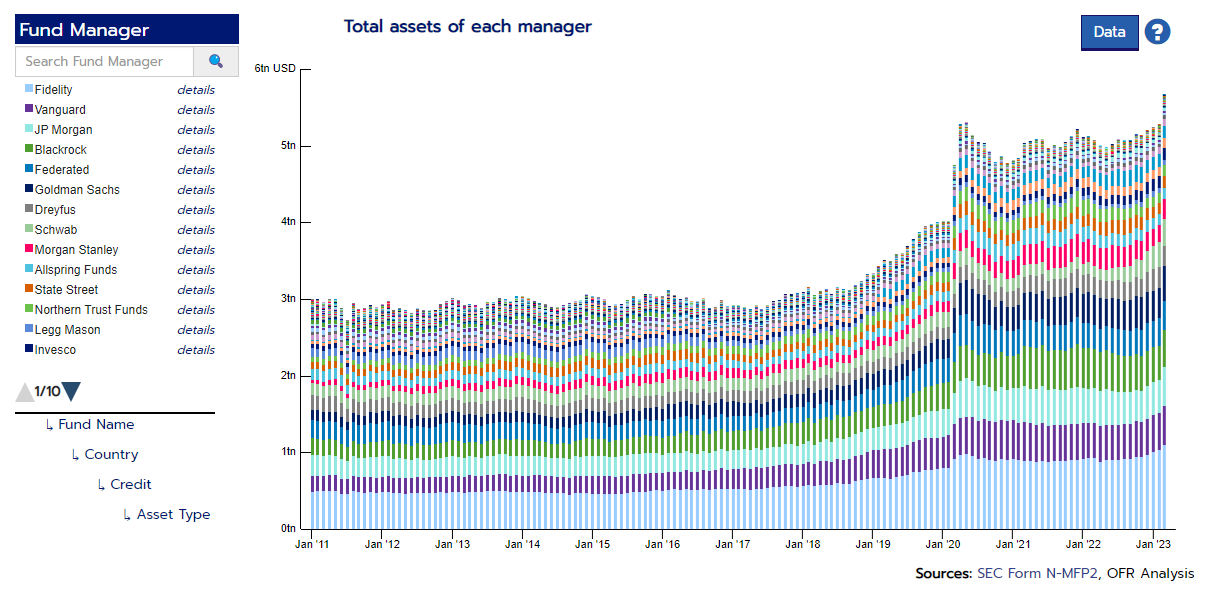
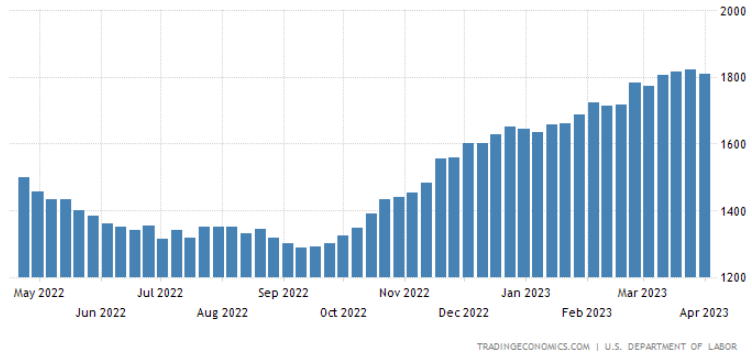
The story of this month in one chart is the Money Market Funds growth. It has added around half a trillion of
inflows from regional banks as depositors have moved their money from bank savings to the money market. The
previous such big move happened during the corona virus crisis in March 2020.
GDP is currently projected to be 2+% for Q1 2023. Even the blue chip consensus forecast have climbed higher not
withstanding the deposit crisis in banking. Our guess is that the deposit crisis is yet to work through the
economic engine and impact GDP growth rates.
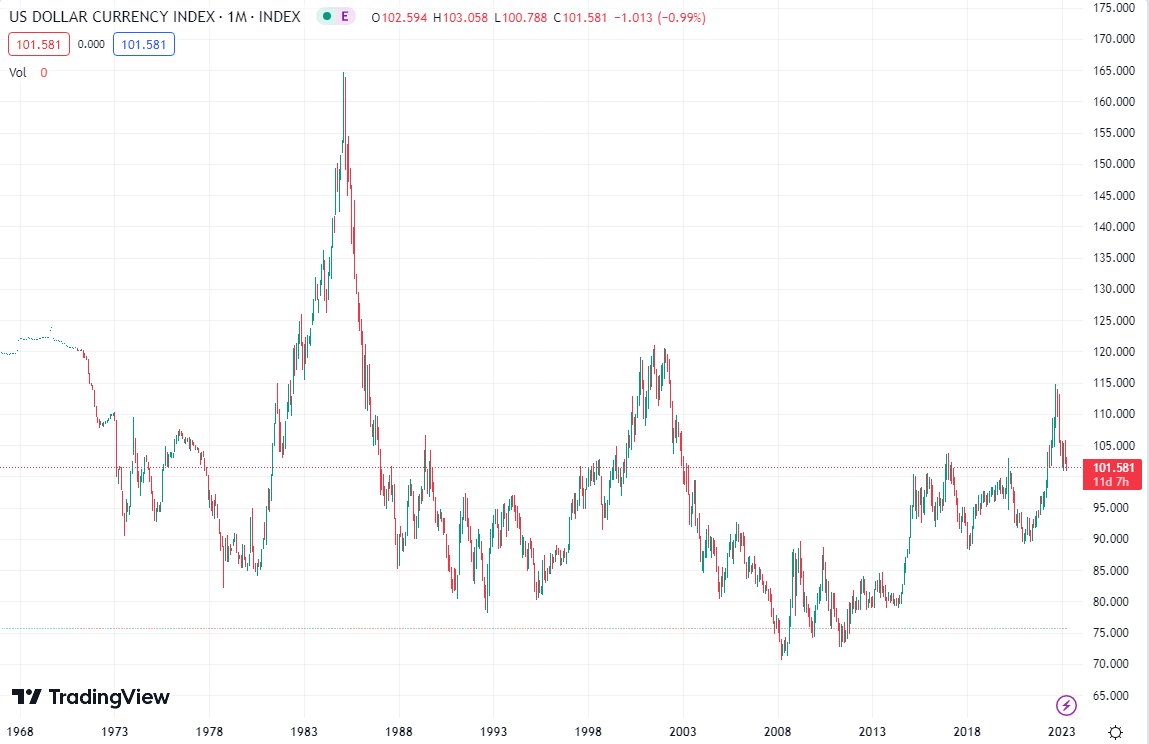
The dollar has softened over the past month. While China has been making bilateral deals with many contries
to avoid dollar based trades, it is yet to be seen if the softening is an effect of such activities.
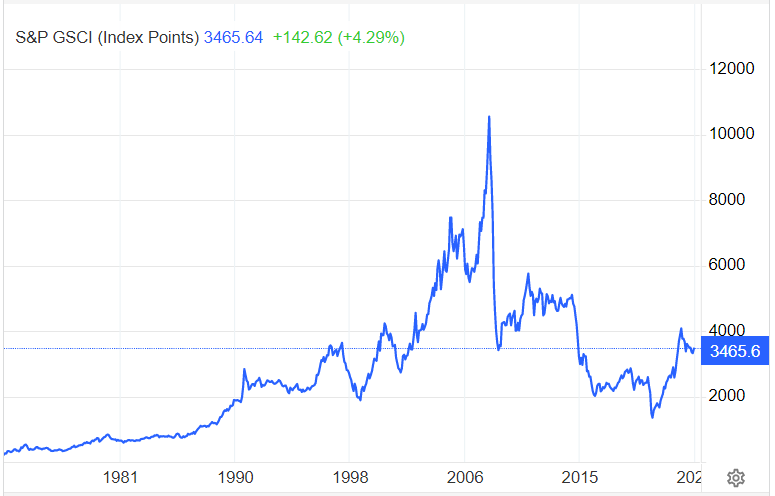
The easing in commodity prices continue from last couple of months. Increase in yields over the past month as well as
the uncertain demand in the future as the economy slows both dampen the spirits in energy prices.
For the first time in a while, we are seeing energy is contributing to bringing inflation down!
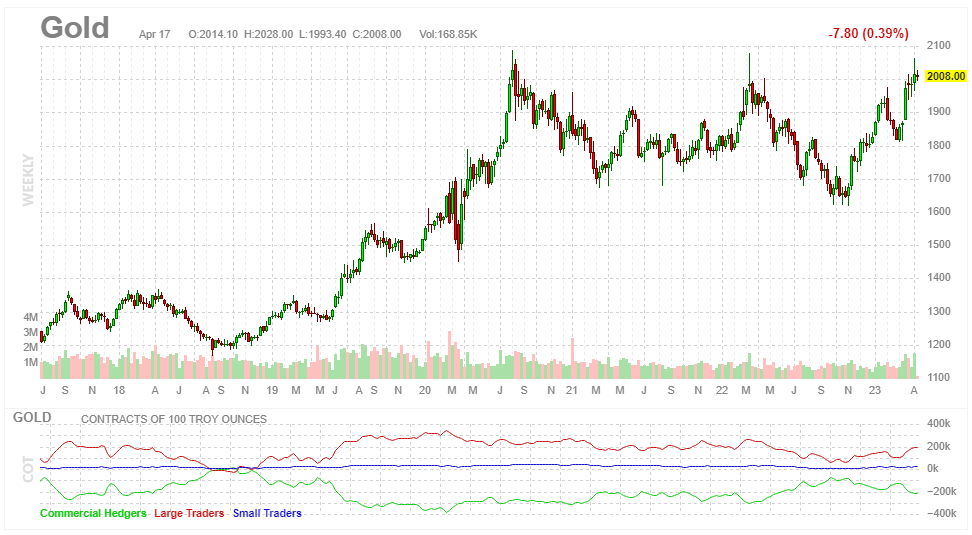
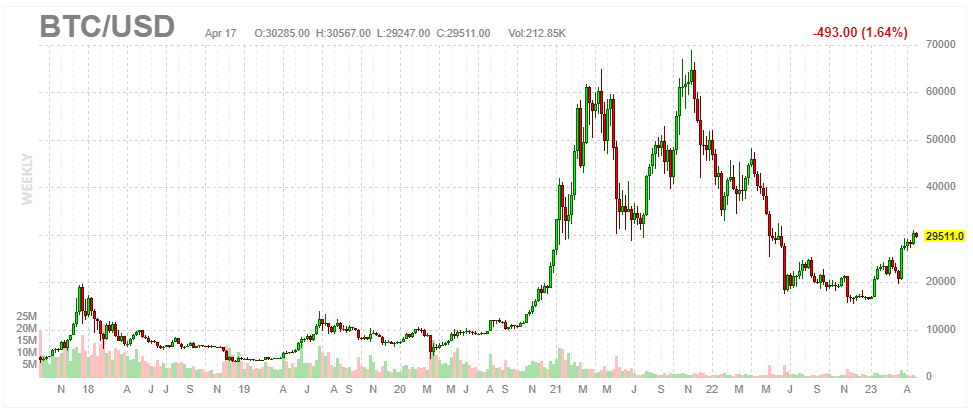
Gold and Bitcoin have continued their climb. The rise is in spite of a resumption in the rise of short term interest rates
and softening inflation data. The market may be acknowledging the potential of a slowing dollar.
Gold and Bitcoin have continued their climb. The rise is in spite of a resumption in the rise of short term interest rates
and softening inflation data. The market may be acknowledging the potential of a slowing dollar.
Inflation
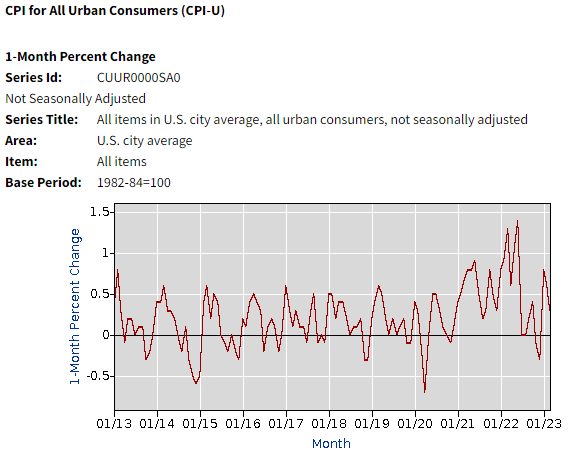
In the month of March, inflation climbed by 0.3%. This has been in line with consensus expectations.
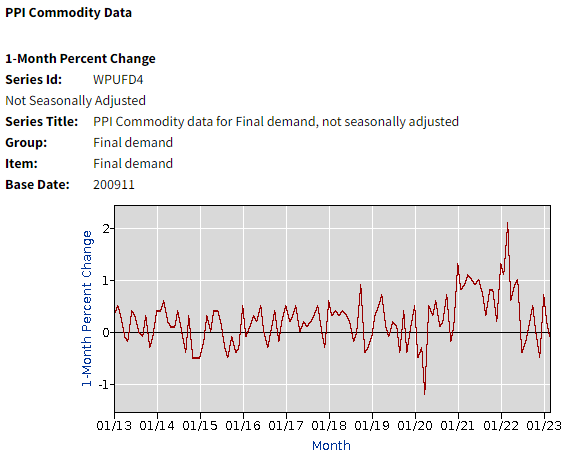
PPI, however, has remained muted with a 0.1% fall in March. This certainly moved the markets on the day
when the report came out.
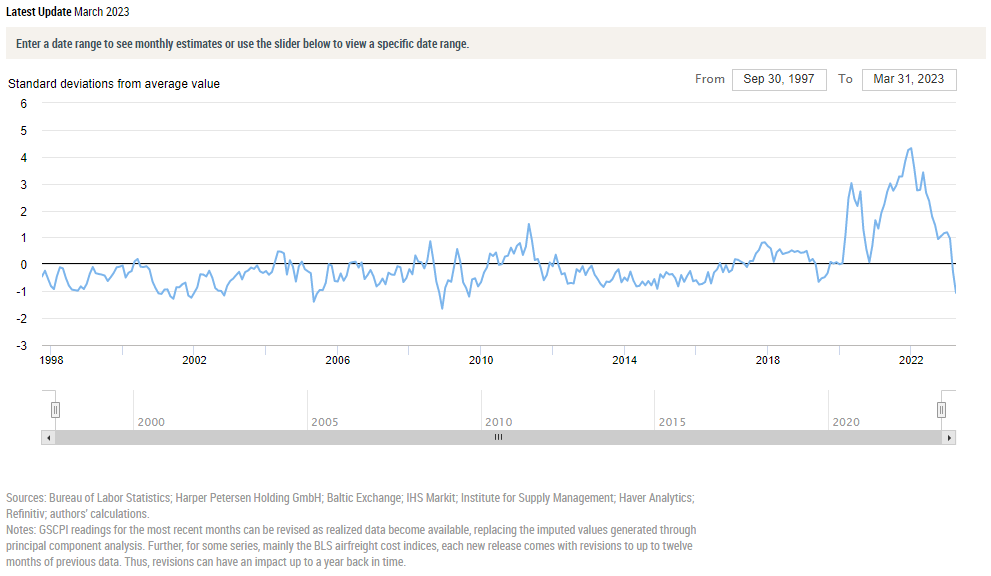
If you believe the rise in inflation was transitory, here is a comforting chart. Many believe the cause
of inflation was due to supply side constraints caused by COVID shutdowns across the world. This chart tracks
the pressure on global supply chain. Clearly, according to this data, the pressures have been coming down and is
now 1
below the normal pressure.
This chart has continued its trajectory downward.
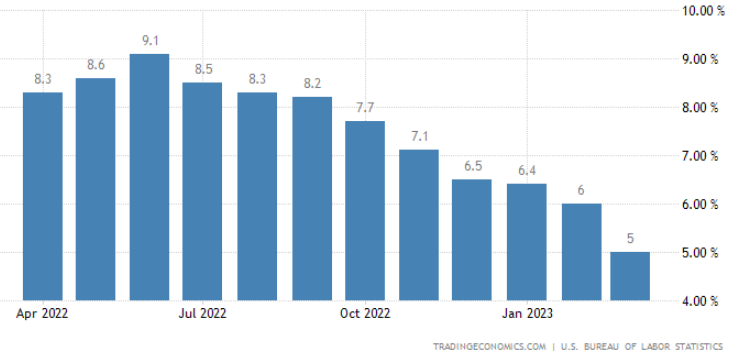
This is the headline inflation number that everyone talks about. Currently, for March 2023 we are at 5.0%, a full
percentage point below the previous month's number!
Although, inflation is known to be sticky, the current trajectory is definitely very promising.
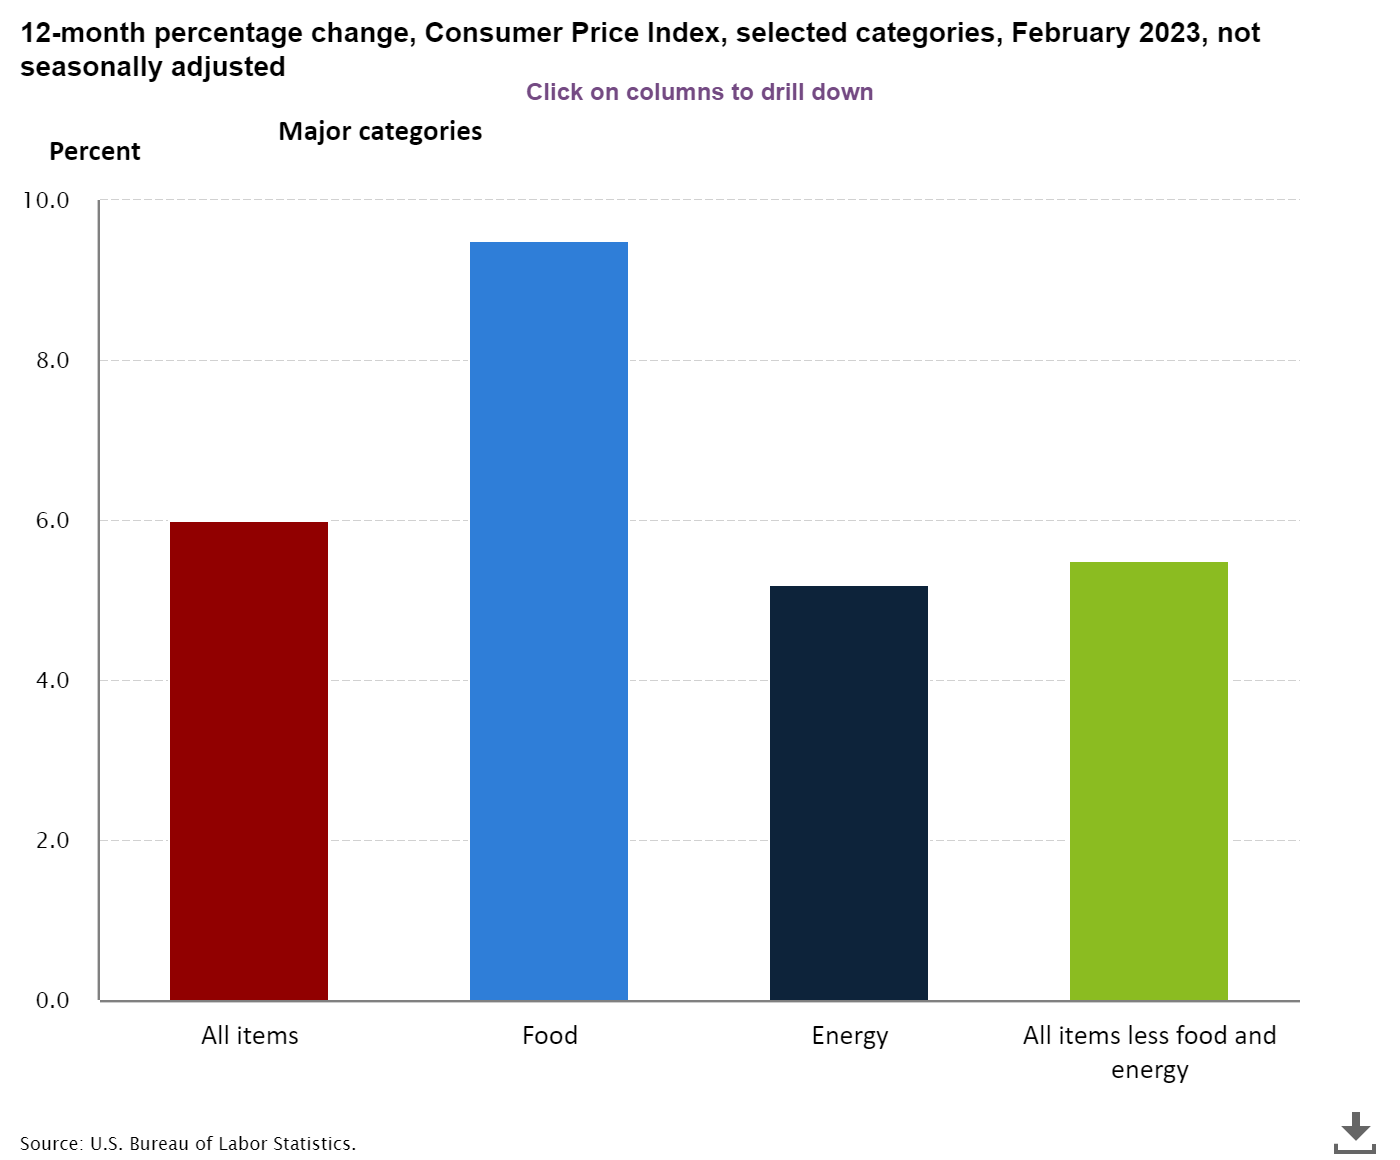
CPI Components Last Month
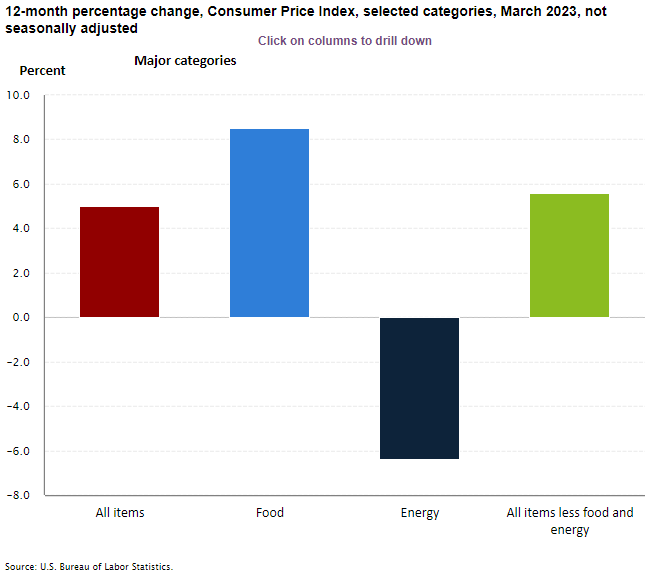
CPI Components This Month
All components of inflation are seen moderating. As mentioned earlier, energy's contribution to inflation
is negative in a long while!
(Please note that the y-axis in both the graphs have different scales).
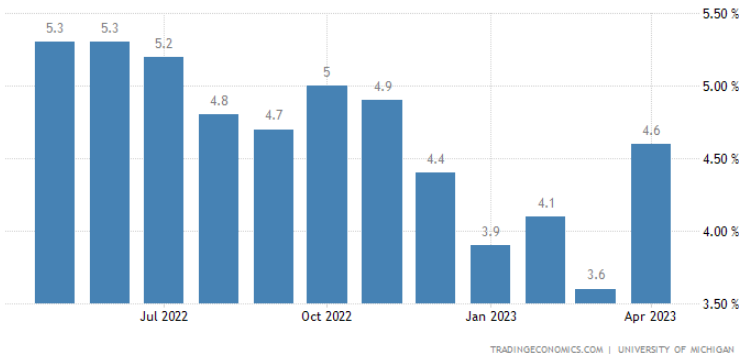
This survey data shows that inflation one year from now is expected to be 4.6%, a reversal from the trend
downwards. Not sure what the survey participants are envisioning, perhaps a hot jobs market remaining hot for a long time.
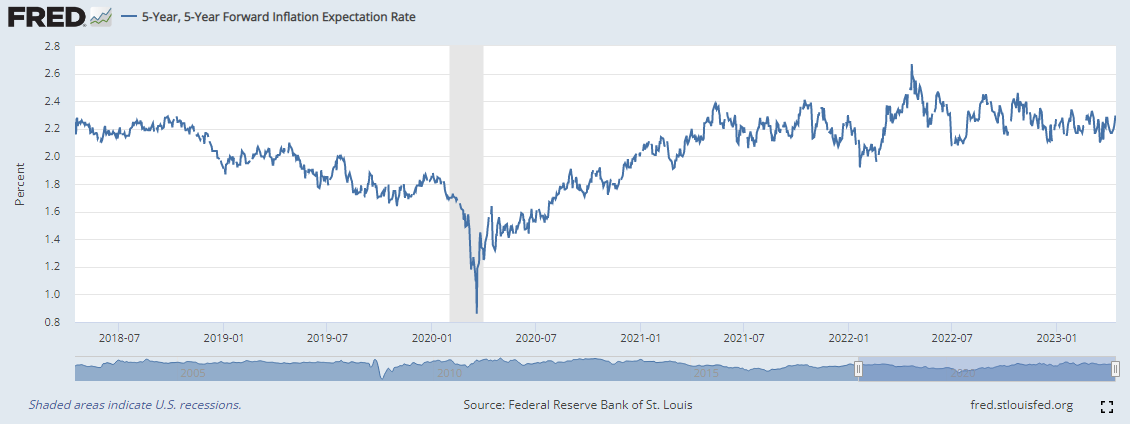
This is a market based indicator showing the inflation in 5 year forward interest rate, 5 years, is in a 2
handleIf a measure such as stock price ranges in 35.01 through 35.99, the stock price is said to have a handle of 35.
.
This indicates the current inflation bout is just a blip in the radar and not an indicative of a structural change in the
economy.
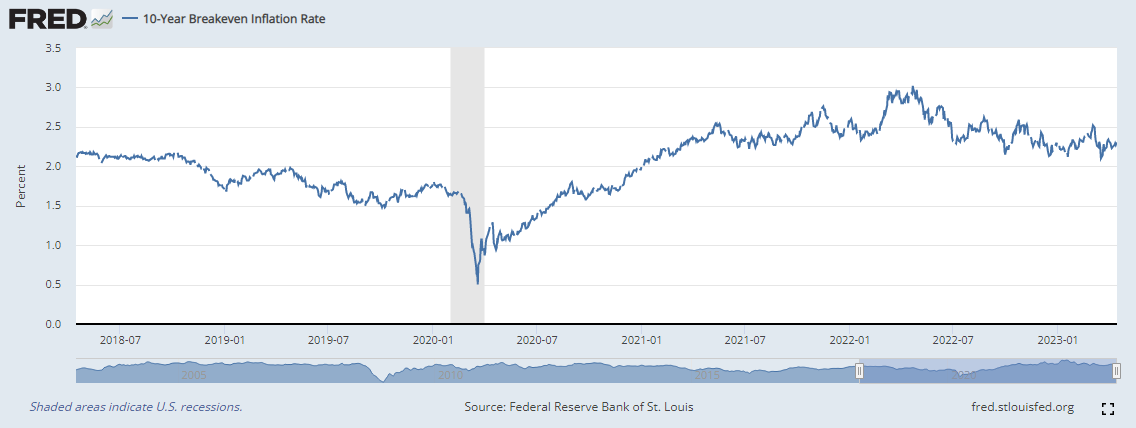
This is another market based indicator showing the inflation 10 years from now is in a 2
handleIf a measure such as stock price ranges in 35.01 through 35.99, the stock price is said to have a handle of 35.
.
This indicates the current inflation bout is just a blip in the radar and not an indicative of a structural change in the economy.
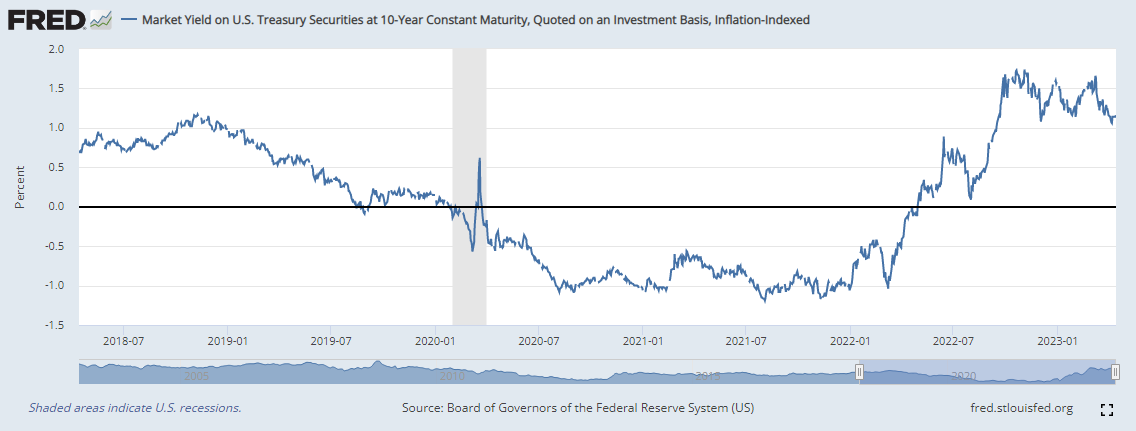
It is great to see real yields in the positive territory after a long period of being on the negative side.
This indicates the optimism in bonds where you can make some positive
carryYield on the investment.
.
It has bounced back after the decline following the banking crisis confirming the resistance around 1%.
Sentiments
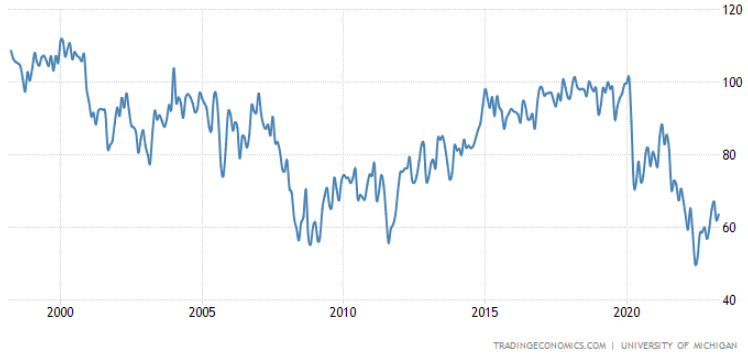
The survey indicator for consumer sentiments remains just fine. It is good to see it has not declined considerably
after the January effect last month.
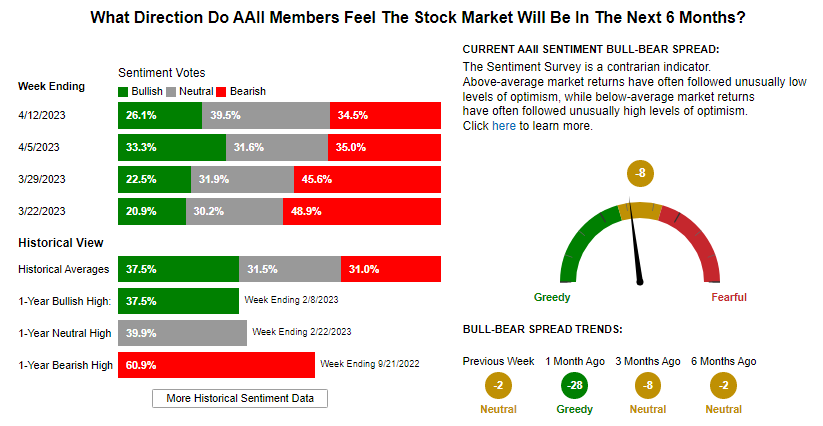
The investors have remained bearish for a while. With the earnings season, we are likely to see more
volatility in equities in the coming weeks. It will be interesting to see if investors get further
pessimistic as the earnings season progresses into May (upholding the cliche 'Sell in May and go away').
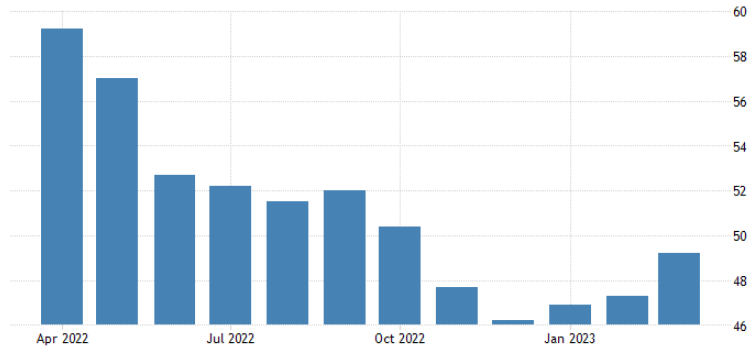
GDP Factors
Manufacturing PMI reading bounced a bit from last month but still below 50 indicates a contraction which is not great and does not share the Atlanta
FED optimism on GDP growth. More so, this may indicate the slowdown in the economy that is yet to come. However,
in the last few months, we are seeing a bump to the positive side and we hope it continues to build up to above 50.
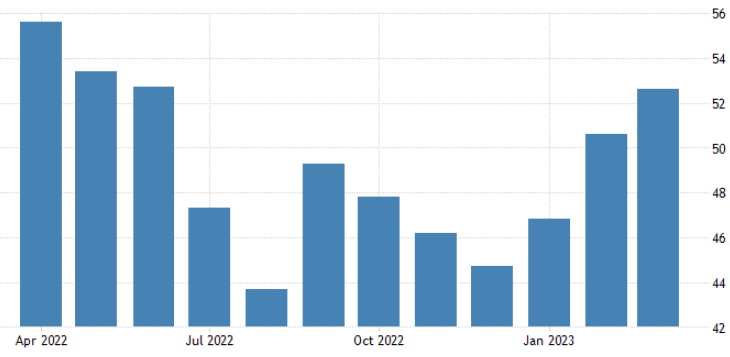
Services PMI reading has pushed past 50 and continues the trend from last month1 Many are jumping to the conclusion that this may
indicate a soft or no landing scenario, essentially implying that we may avoid a recession.
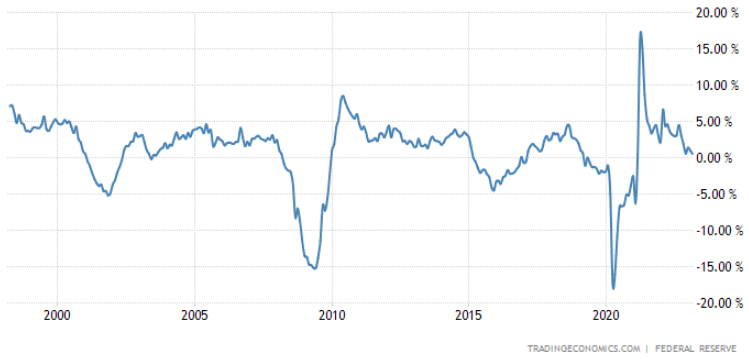
Industrial Production remains close to zero.
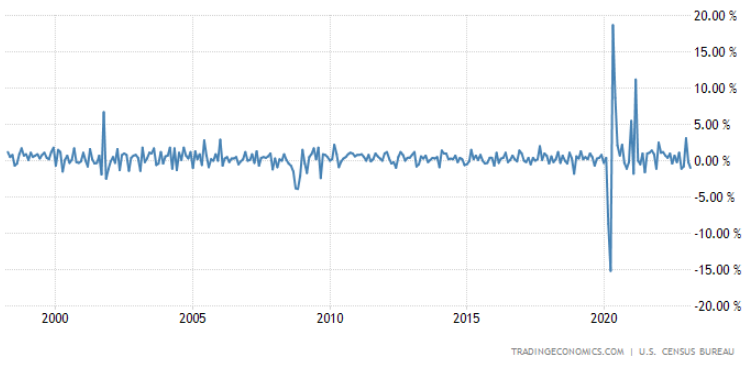
Retail Sales has remained negative in the last two months in a row. Perhaps the holiday sales lacuna is a reason, perhaps
consumers are seeing the pinch from continued inflation.
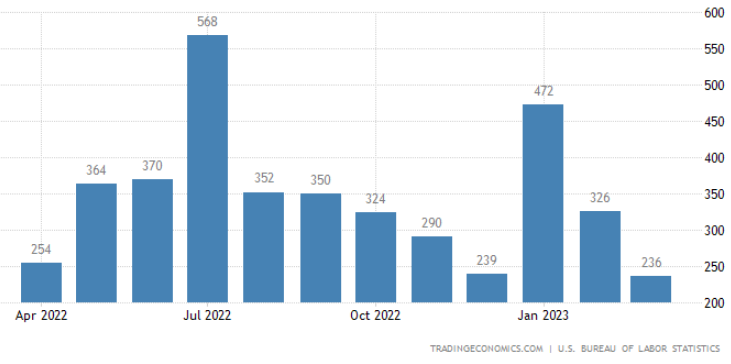
Non-farm payrolls have stubbornly been too good indicating economy is still adding jobs. This month the jobs
number was inline with expectation but too high to indicate any slowdown in job growth. This just makes FED's job
so much harder.
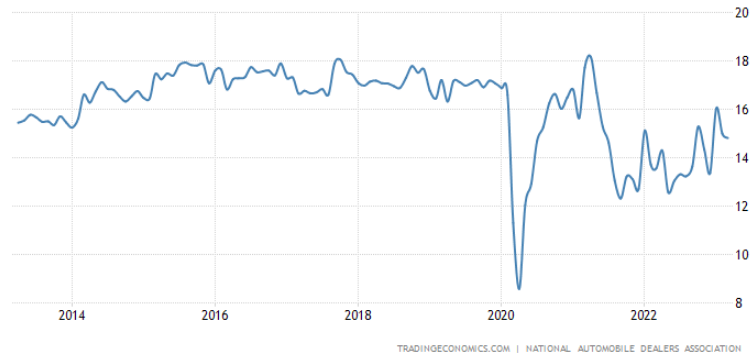
Total Vehicle sales continues to be within its trend band higher.
The used car prices are starting to inch up again seemingly the demand is coming back up. It may also be
indicating a slowdown in inflation ahead.
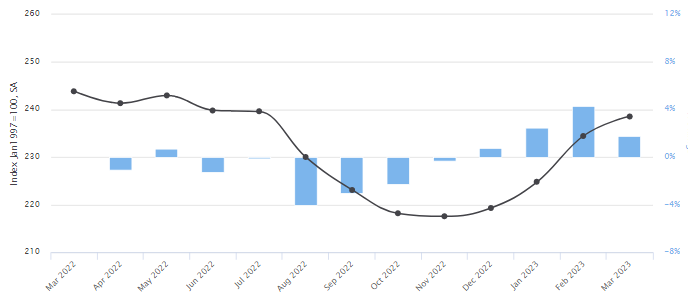
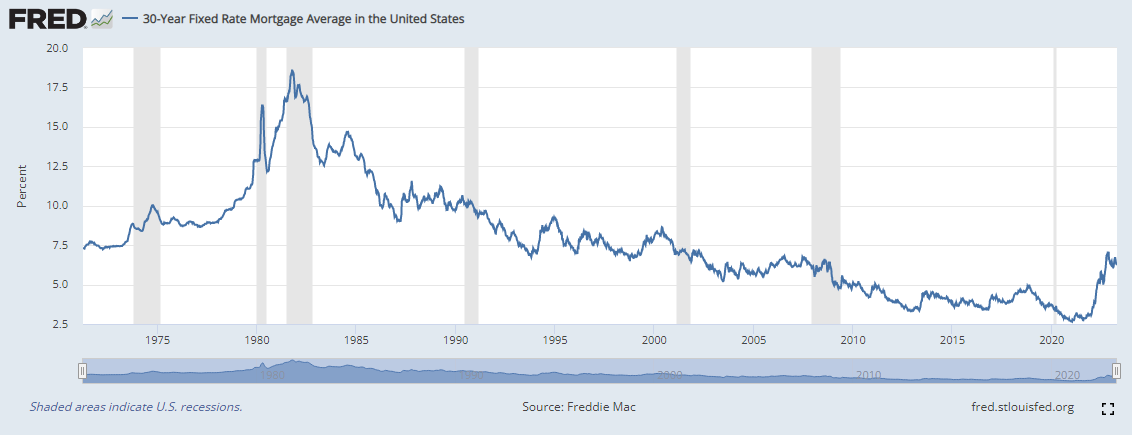
New home sales are starting to tick up again. Perhaps new buyers are feeling courageous to take on the higher
mortgage rates thinking it may only go higher in the coming months.
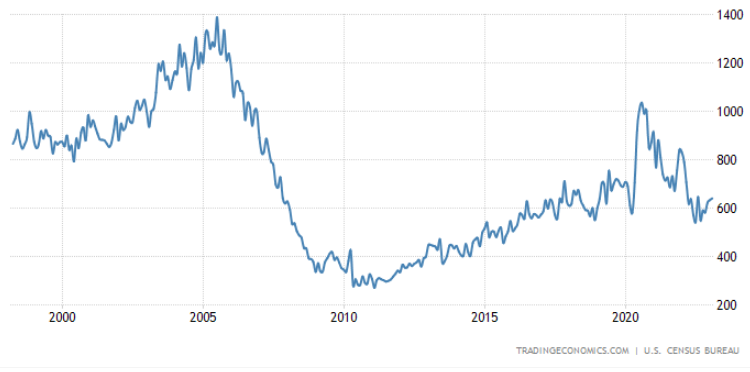
The mortgage rates are stabilizing and buyers have been coming back to the market. The housing market is showing
signs of thawing as spring has arrived.
Employment Indicators
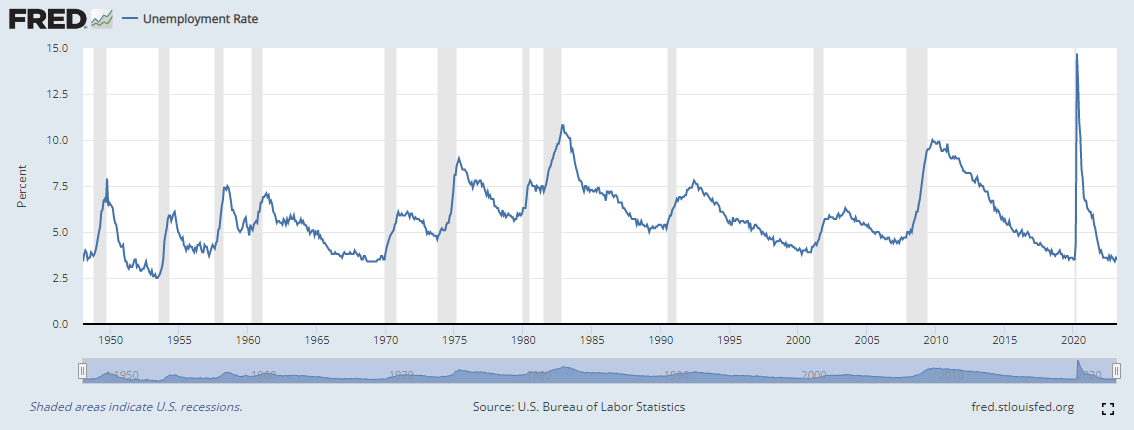
The unemployment rate has remained low despite the FED's attempt to induce a slowdown. This indicator is a lagging
indicator and we do expect to see this number creep up in the months to come.
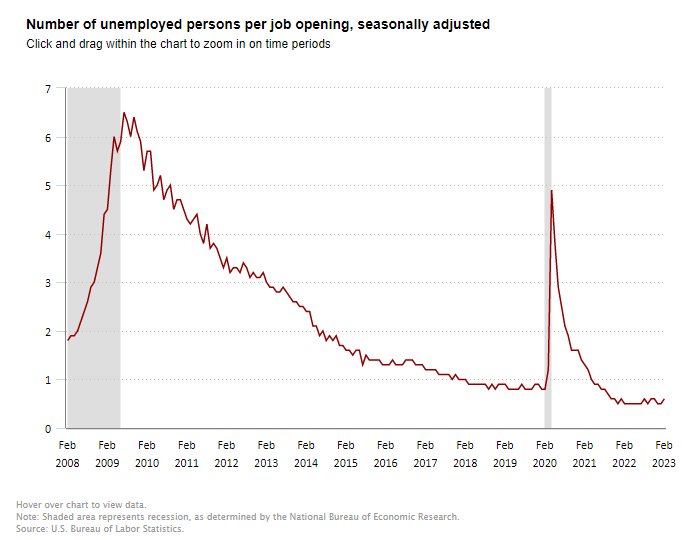
There are about 2 job openings for every unemployed person looking for a job.
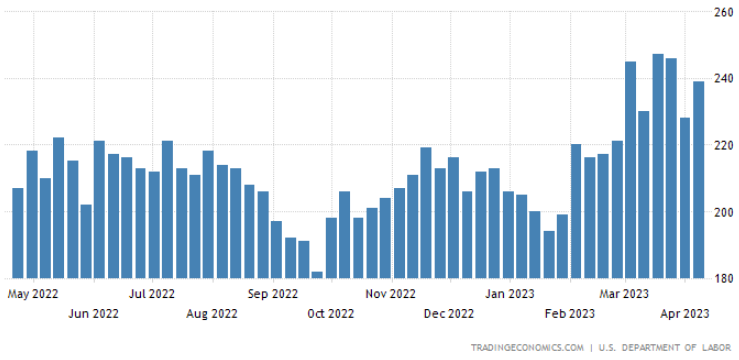
This chart will be the first indicator of a telltale sign that unemployment is increasing. As you see the continuing
jobless claims number rise, it implies the people who lost their jobs are not going back to labor force fast enough
and the unemployment rate is starting to creep higher.
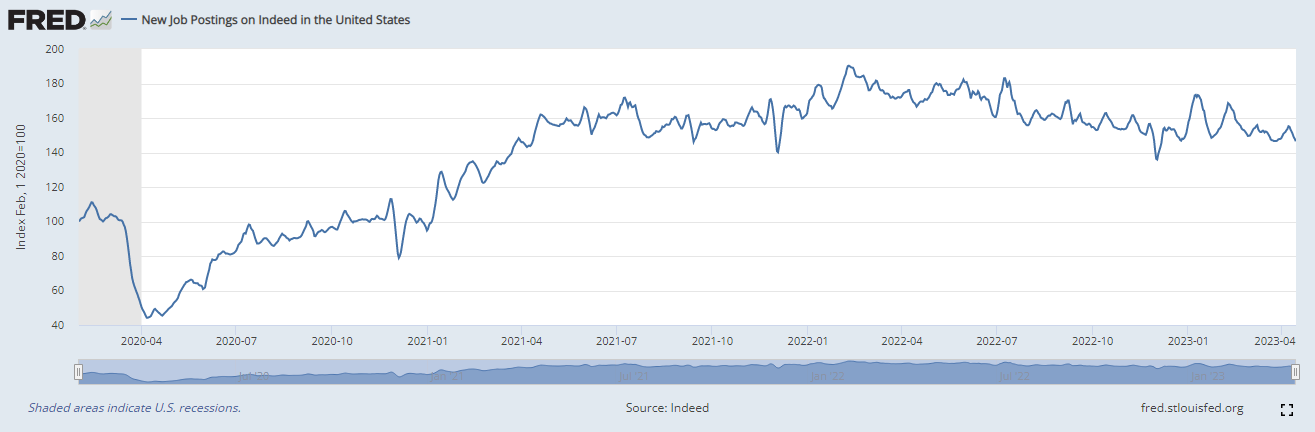
Interestingly, the rate of change in job postings is reducing but the total jobs are still rising according to
this indicator. While this is consistent with the BLS report on job openings to unemployed, we expect to see
some sharp corrections if a recession is imminent.
This month, the wage inflation is exceeding the headline inflation as it recorded a reading of 6.4% compared
to the headline inflation of 5%. This is an indication that inflation is being entrenched and may lead to
wage/price spiral. Something that the FED does not want to see and makes it likely to keep rates higher for longer.
Market Indicators
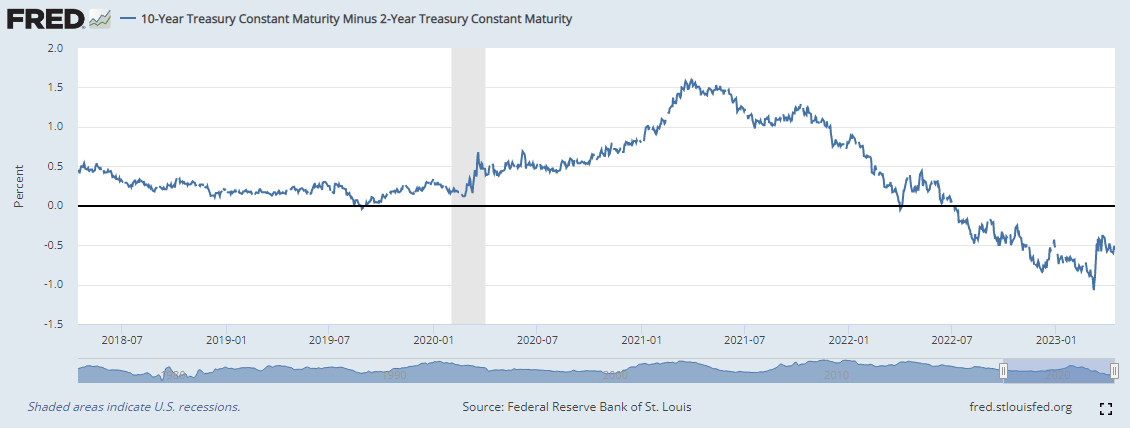
The excitement last month on the inversion in the yield curve reverting did not last long. The short and
long term yields continue to rise as we expect FED to continue to raise rates in their next meeting in May.
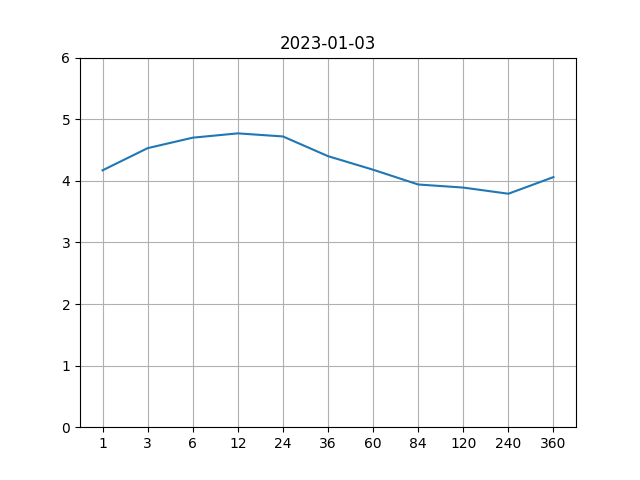
Yield curve - Then
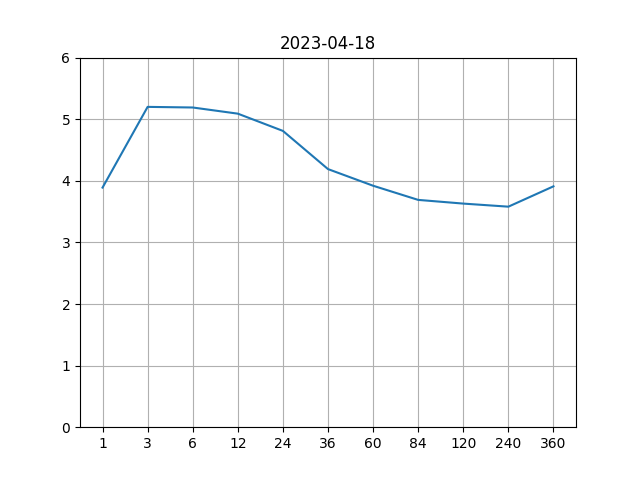
Yield curve - Now
No joy here as yet. Last month, there was some excitement around the inversion in yield curve correcting, but
it turned out to be short lived. FED seems to have successfully contained the banking crisis. Now, the rates
are starting to push higher again.
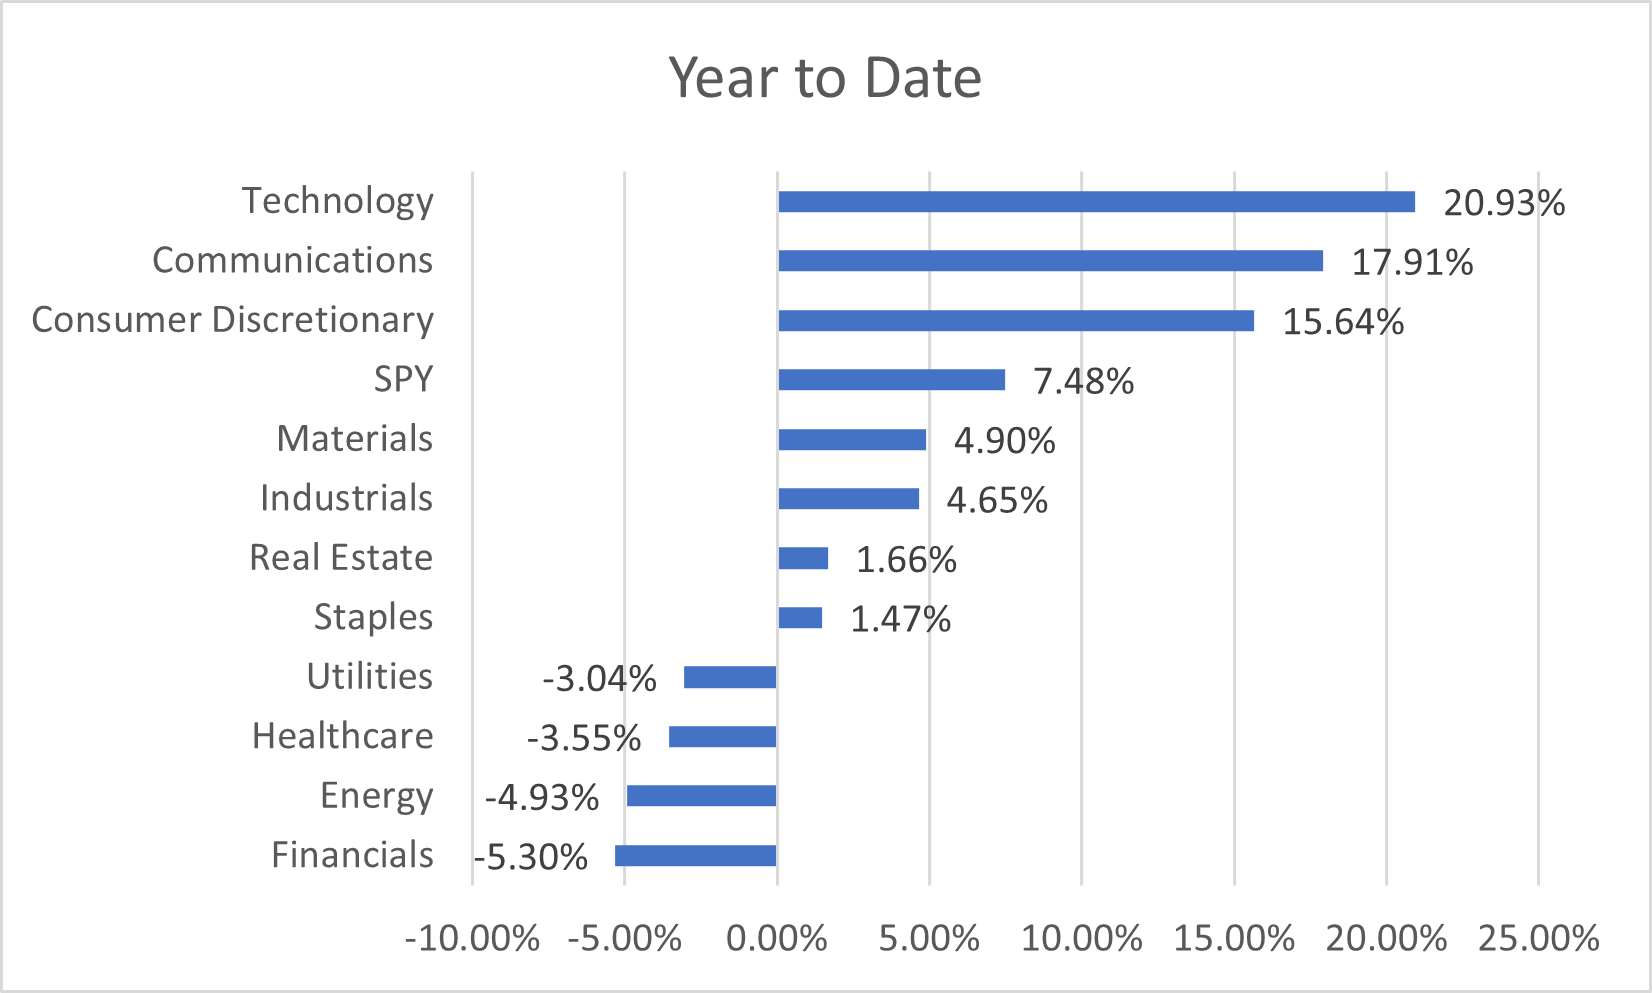
Year to date, technology and communication sectors and back to being the leaders. Is this a dash for trash, long duration
trade back on again? Or is this for real this time? The developments in the banking sector foretells this move is short-lived.
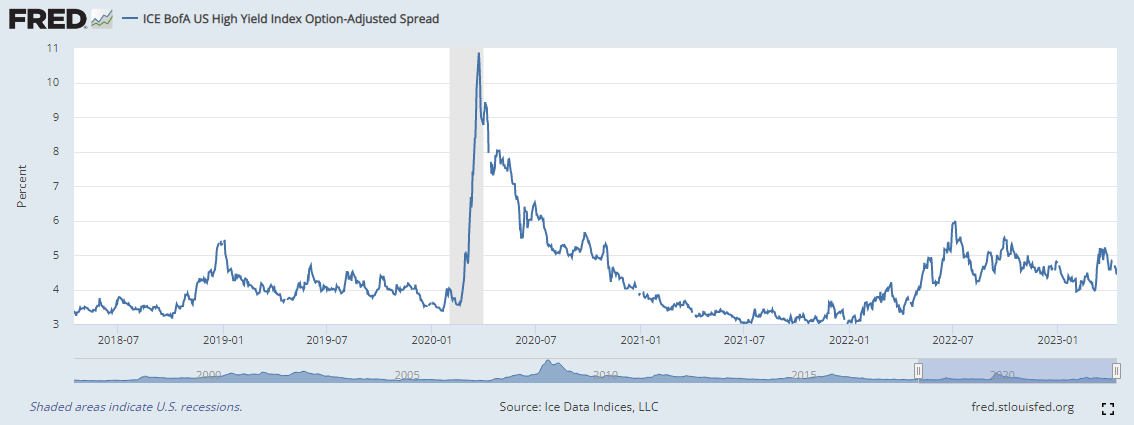
If the economy were to enter a recession, it is likely that some of the companies will struggle to keep up with
their debt payments causing their credit spread to widen. This indicator shows how the credit spreads have been
behaving so far.
Since the SVB banking crisis, the credit spread has been contracting! This
indicates a credit crunch is not imminent.
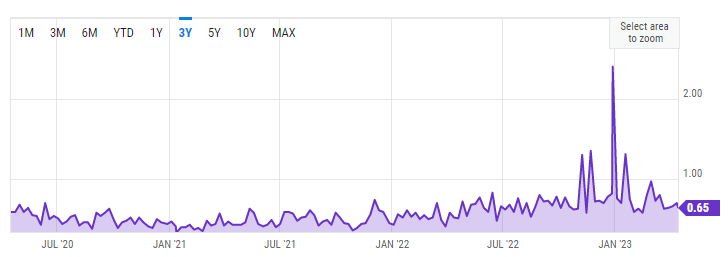
A spike in put / call ratio indicates that investors are very apprehensive about a sudden fall in the equity
markets. In March, the activity has been quite well behaved in the overall market (SPY) in spite of the turmoil
in the banking sector.
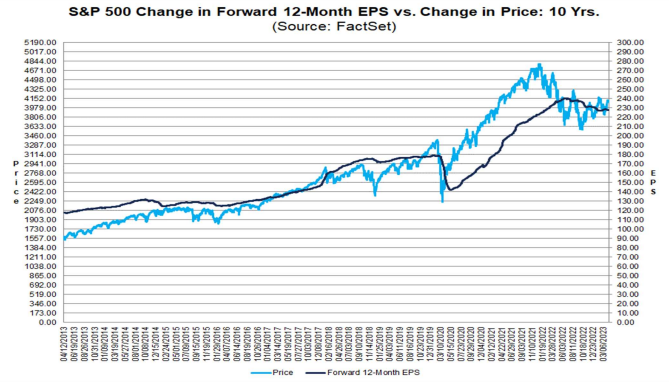
The current earnings forecast by equity analysts estimate the earnings potential for S&P 500 companies to be
around $230 which translates to a price to earnings ratio of 17.1 at the current S&P 500 price level. This
is just below the 10 year average.
It is likely that as inflation comes down, so will the earnings numbers. This indicates that the future S&P 500
price level could likely come down. Based on the companies that have reported so far,
the earnings have declined by -6.5%.
- Trillium Square Advisors LLC is a registered investment adviser offering advisory services in the state of North
Carolina and in other jurisdictions where exempted. Registration as an investment adviser does not imply a
certain level of skill or training, and the content of this communication has not been approved or verified by the
United States Security and Exchange Commission or by any state securities authority.
- Information presented is for educational purposes only and does not intend to make an offer or solicitation for
the sale or purchase of any specific securities, investments or investment strategies. Market data, articles and
other content in this presentation are based on generally available information and are believed to be reliable.
Trillium Square does not guarantee the accuracy of the information contained in this presentation. The
information is of a general nature and should not be construed as investment advice and relied upon in making
investment decisions.
- Investments involve risk and are never guaranteed. Be sure to first consult with a qualified financial adviser before
implementing any strategies discussed herein.
- Past performance is not indicative of future performance.
- The content of this communication and any accompanying documents are not to be copied,
excerpted or distributed without express written permission of the firm. Any other use beyond its author’s intent,
distribution or copying of the contents of this presentation is strictly prohibited. Nothing in this document is
intended to be legal, accounting, or tax advise, and is for informational purposes only.
- Hypothetical performance results have many inherent limitations. No representation is being made that any
account will or is likely to achieve profits or losses similar to those shown. In fact, there are frequently sharp
differences between hypothetical performance results and the actual results subsequently achieved by any
particular investment strategy. Hypothetical performance for illustration purposes only.
- Trillium Square will provide all prospective clients with a copy of our current Form ADV, Part 2A (Disclosure
Brochure) upon request. At anytime you can view our current Form ADV, Part 2A at https://adviserinfo.sec.gov
© Copyright Trillium Square Advisors LLC. All rights reserved.
Main Address:
Trillium Square Advisors LLC,
423 Peaslake Ct, Rolesville NC - 27571
Office Address:
Trillium Square Advisors LLC,
2840 Plaza Place, Suite 210, Raleigh, NC - 27612
Website Content
All written content on this site is for information purposes only. Opinions expressed herein are solely those of Trillium Square Advisors LLC unless otherwise specifically cited. Material presented is believed to be from reliable sources and no representations are made by our firm as to another parties’ informational accuracy or completeness. All information or ideas provided should be discussed in detail with an advisor, accountant or legal counsel prior to implementation.
This website may provide links to others for the convenience of our users. Our firm has no control over the accuracy or content of these other websites.
Registration Information
Advisory services are offered through Trillium Square Advisors LLC; an investment advisor firm domiciled in the State of North Carolina. The presence of this website on the Internet shall not be directly or indirectly interpreted as a solicitation of investment advisory services to persons of another jurisdiction unless otherwise permitted by statute.
Follow-up or individualized responses to consumers in a particular state by our firm in the rendering of personalized investment advice for compensation shall not be made without our first complying with jurisdiction requirements or pursuant to an applicable state exemption.
For information concerning the status or disciplinary history of a broker-dealer, investment advisor, or their representatives, a consumer should contact their state securities administrator.