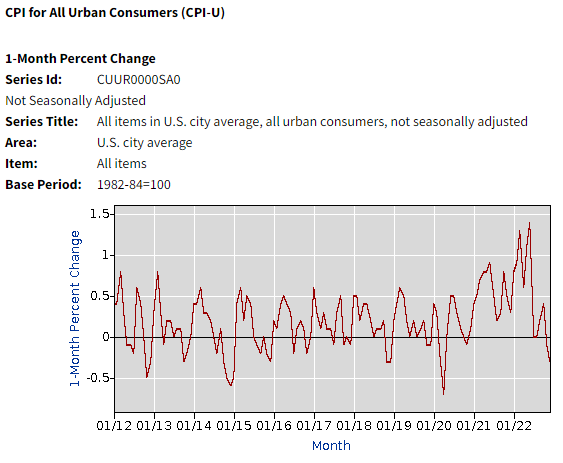
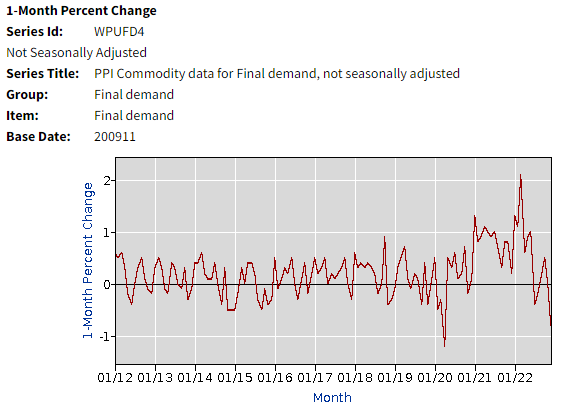
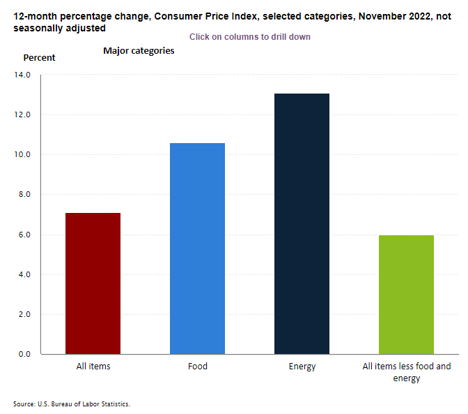
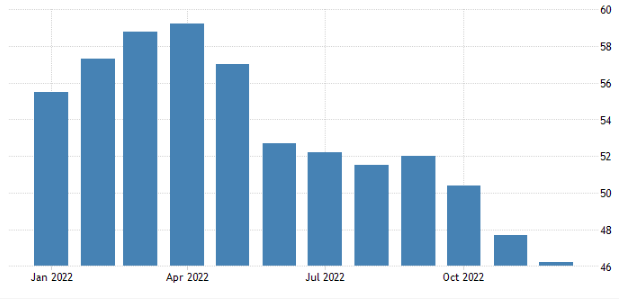
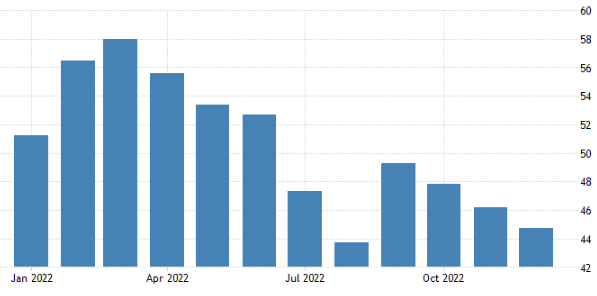
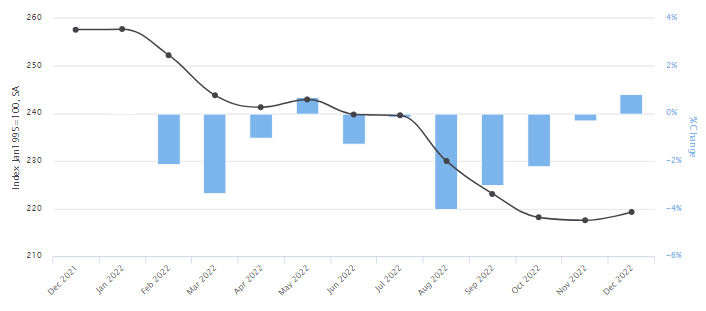
 CPI Components Last Month
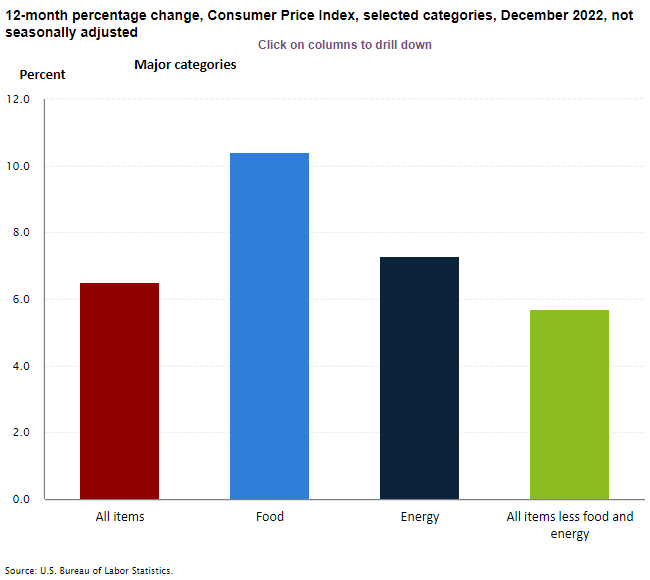 CPI Components This Month
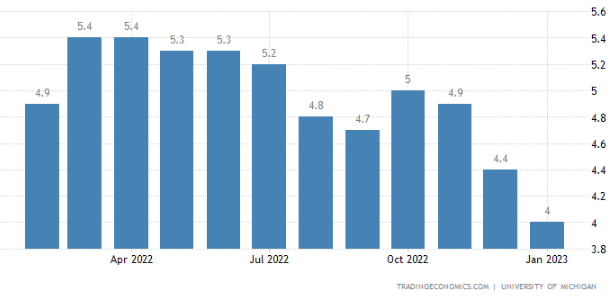
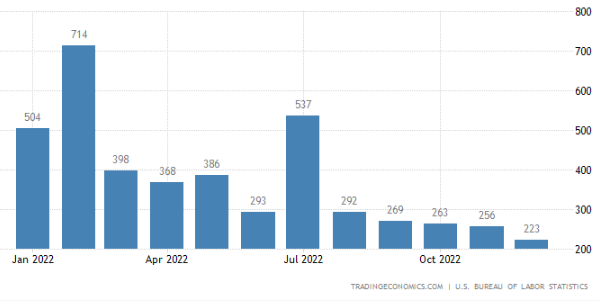
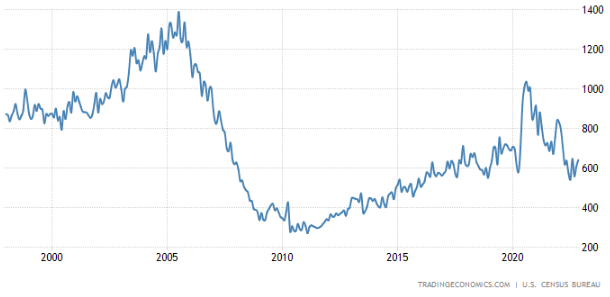
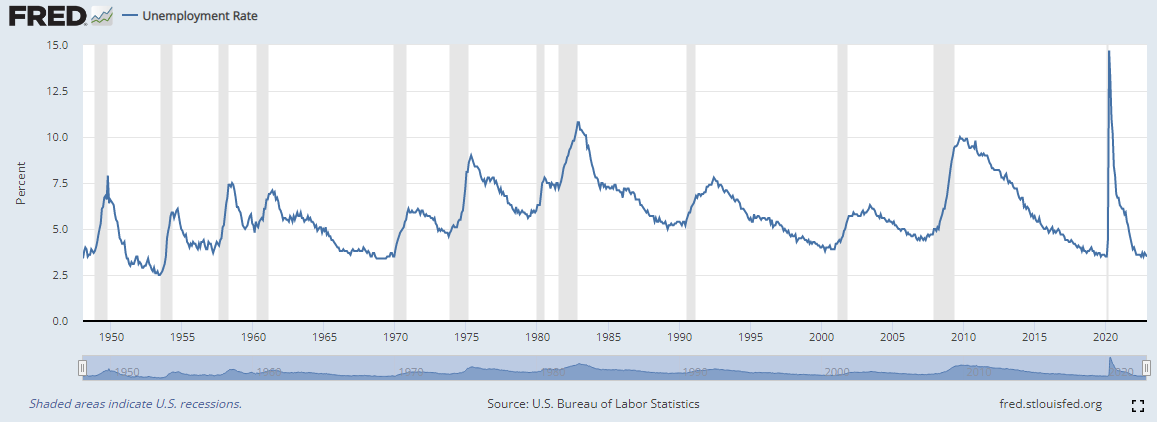
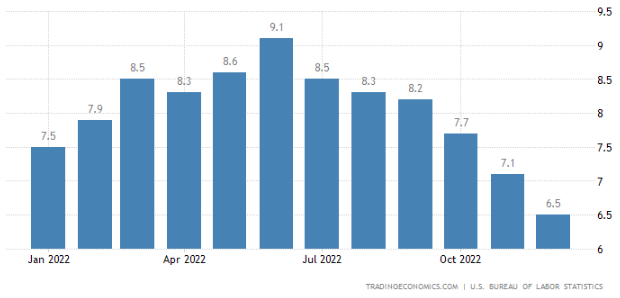
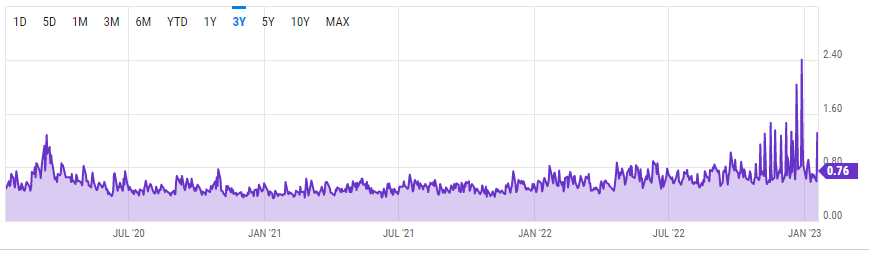
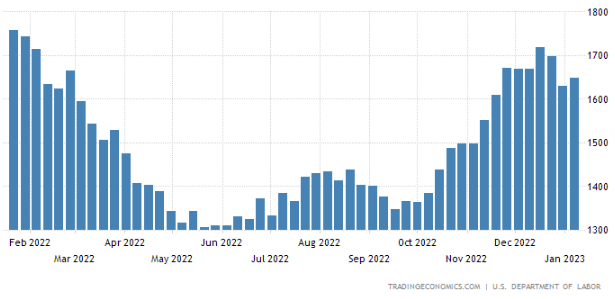 This chart is the first indicator of a telltale sign that unemployment is increasing. As you see the continuing
jobless claims number rise, it implies the people who lost their jobs are not going back to labor force fast enough
and the unemployment rate is starting to creep higher.
This chart is the first indicator of a telltale sign that unemployment is increasing. As you see the continuing
jobless claims number rise, it implies the people who lost their jobs are not going back to labor force fast enough
and the unemployment rate is starting to creep higher.
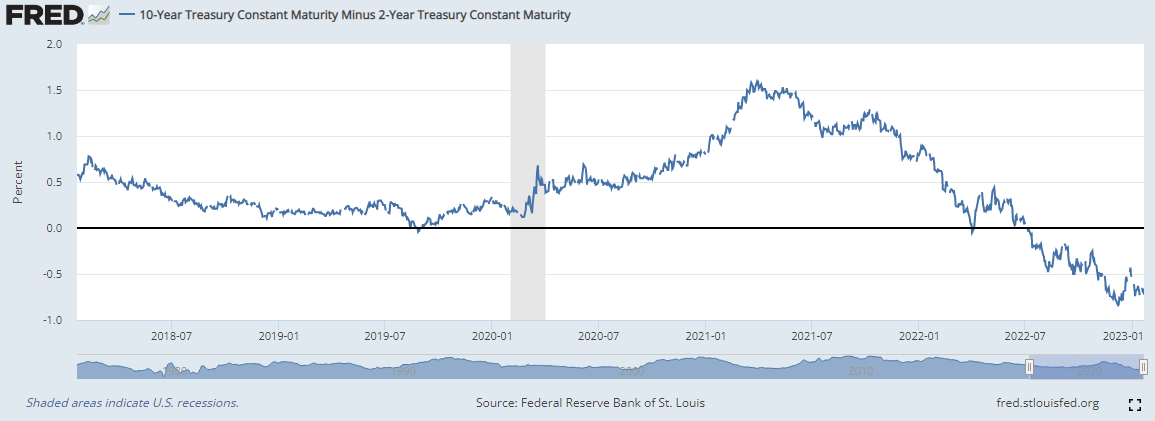
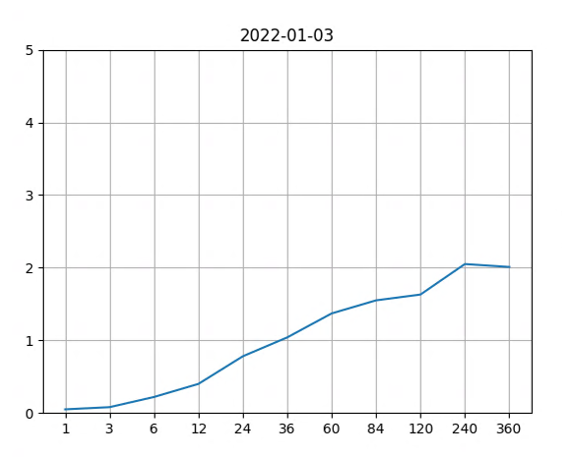 Yield curve - Then
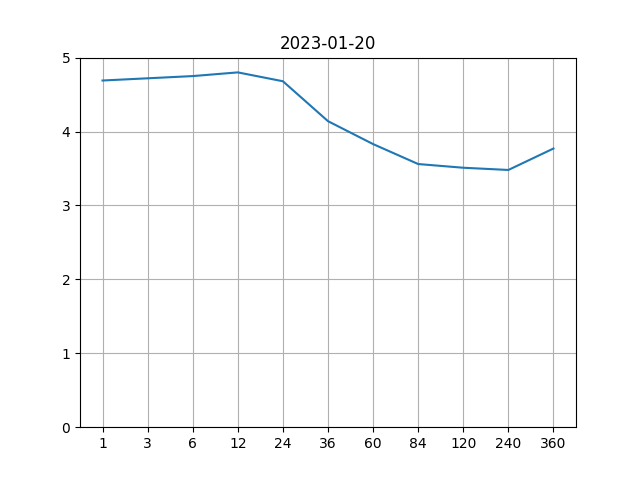 Yield curve - Now
© Copyright Trillium Square Advisors LLC. All rights reserved.
Trillium Square Advisors LLC,
423 Peaslake Ct, Rolesville NC - 27571
Trillium Square Advisors LLC,
2840 Plaza Place, Suite 210, Raleigh, NC - 27612
All written content on this site is for information purposes only. Opinions expressed herein are solely those of Trillium Square Advisors LLC unless otherwise specifically cited. Material presented is believed to be from reliable sources and no representations are made by our firm as to another parties’ informational accuracy or completeness. All information or ideas provided should be discussed in detail with an advisor, accountant or legal counsel prior to implementation.
This website may provide links to others for the convenience of our users. Our firm has no control over the accuracy or content of these other websites.
Advisory services are offered through Trillium Square Advisors LLC; an investment advisor firm domiciled in the State of North Carolina. The presence of this website on the Internet shall not be directly or indirectly interpreted as a solicitation of investment advisory services to persons of another jurisdiction unless otherwise permitted by statute.
Follow-up or individualized responses to consumers in a particular state by our firm in the rendering of personalized investment advice for compensation shall not be made without our first complying with jurisdiction requirements or pursuant to an applicable state exemption.
For information concerning the status or disciplinary history of a broker-dealer, investment advisor, or their representatives, a consumer should contact their state securities administrator.