Summary
Late Cycle Blues - this is the gist of the current state of markets.
We have witnessed the fastest rate hikes in the last half a century. As has always been the case, these rate
hikes precipitate certain events that shine the light on deep cracks in the financial systems. This time, it
is the banking sector once again. Banking can be seen as the circulatory system of the economy. Once that has been
affected, it is very easy to see how various other sectors can get impacted, particularly real estate and other
high capital expenditure oriented sectors.
In the past week or so, we have seen the short term bond yield fall by about one percentage point while the MOVE index
has made yet another record! While the bond market is signalling risk off, the stock market is dashing for
trash stocks. The long duration, high growth, no earnings part of the stock market is leaping to the moon.
Typically, this battle between the bond and the stock market ultimately yields to the commands of the FED.
This time, their decision is complicated by the unrelenting inflation dynamics at one end and deflationary forces
from the banking sector at the other end. Our guess is that they will attend to the acute ailment at the
cost of the chronic ailment aka inflation.
Broad Indicators
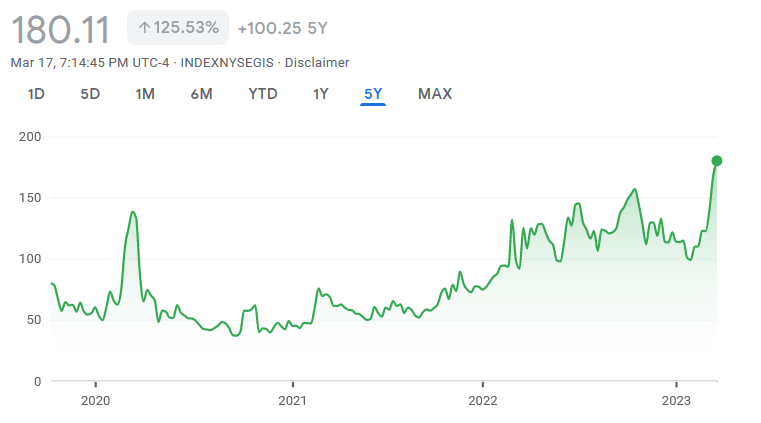
The story of this month in one chart is the MOVE Index. It measures the market's expectation of implied volatility
of the US bond market using 1-month Treasury options.
It recorded the highest value in its history since its inception in 2019. The banking crisis after the Silicon
Valley Bank saga has pushed the short term Treasury yields to fall by about a percentage point.
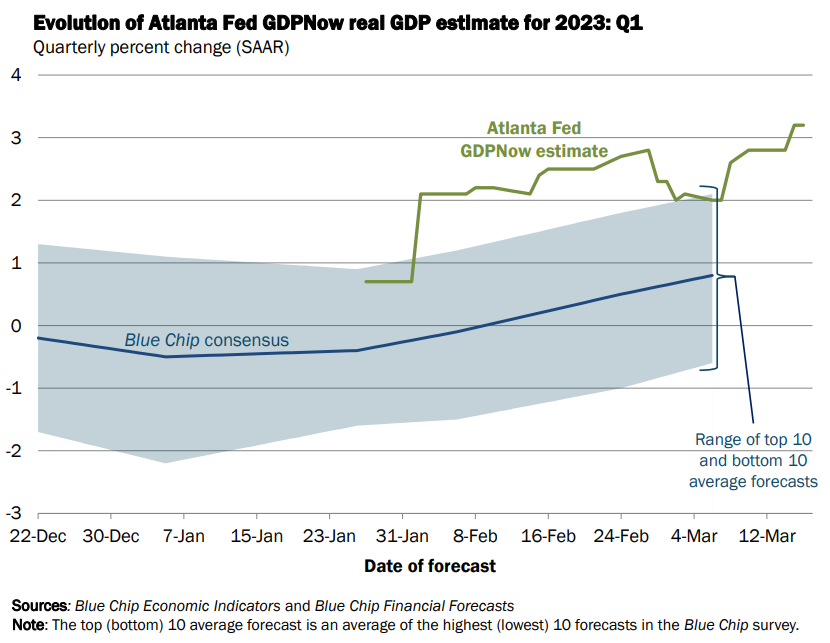
GDP is currently projected to be 3+% for Q1 2023. Even the blue chip consensus forecast have climbed higher. It
remains to be seen if the recent banking crisis puts a dent in this optimism.
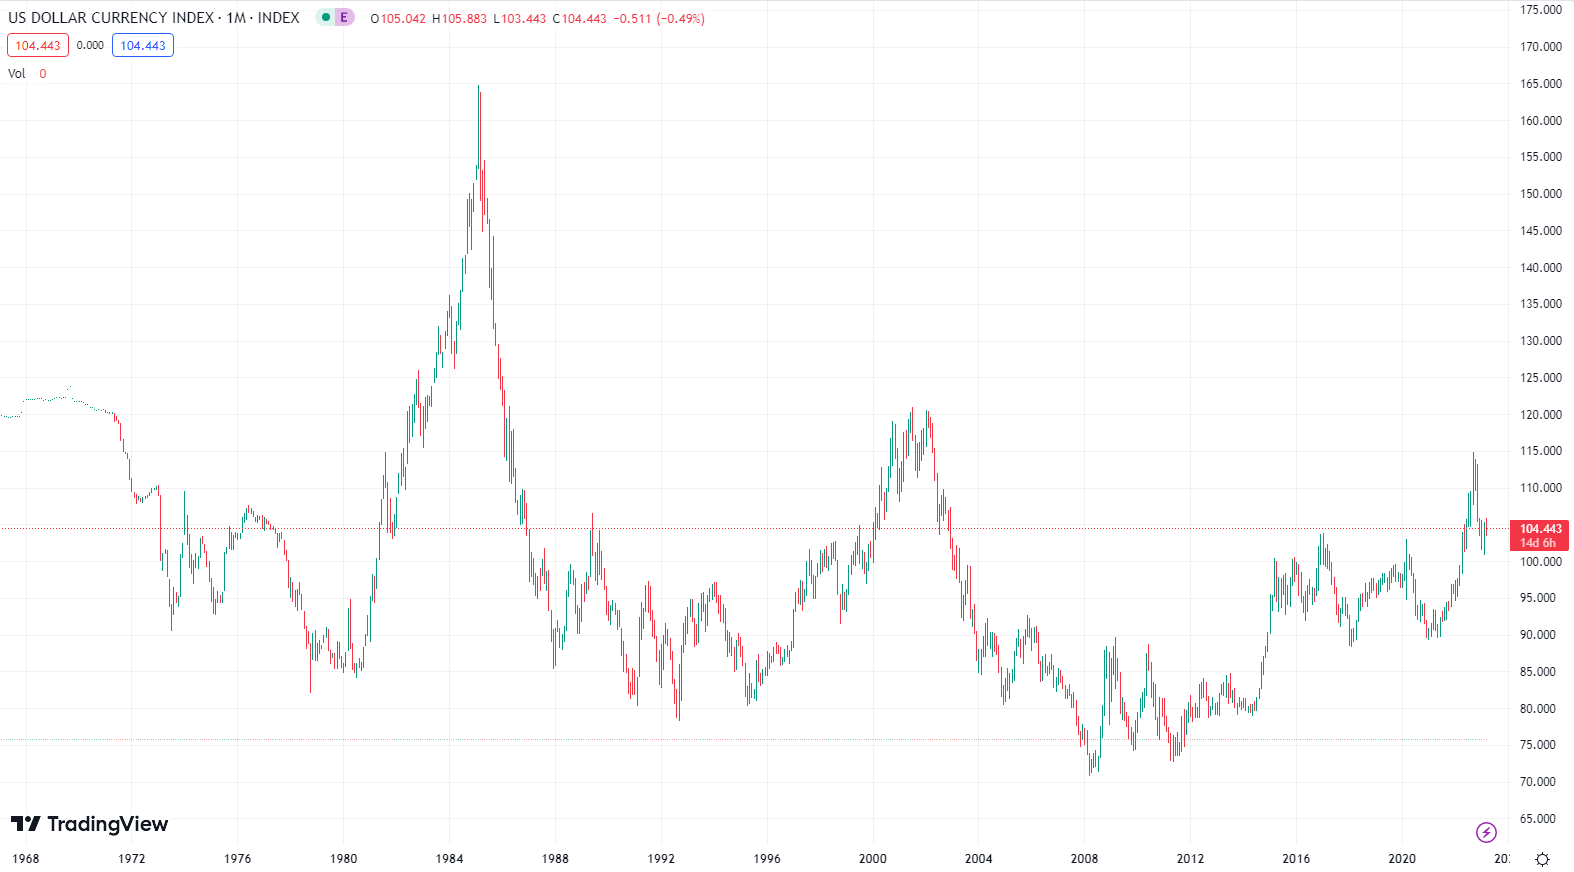
The rise in the dollar index during February has stalled a bit in the last week or so.
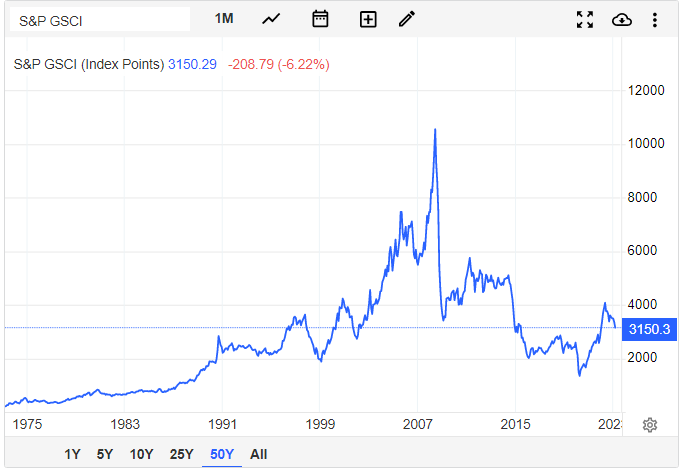
The easing in commodity prices continue from last month. Increase in yields over the past month as well as
the uncertain demand in the future as the economy slows both dampen the spirits in energy prices.
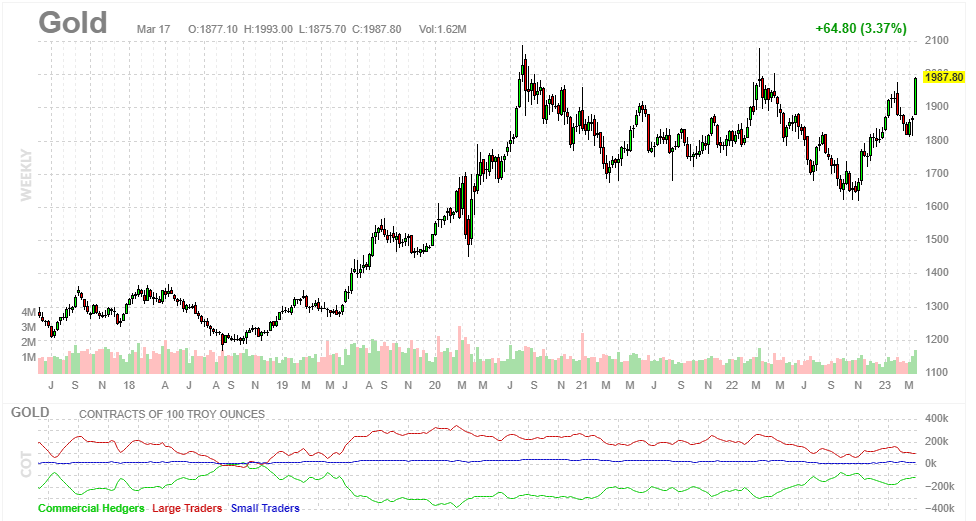
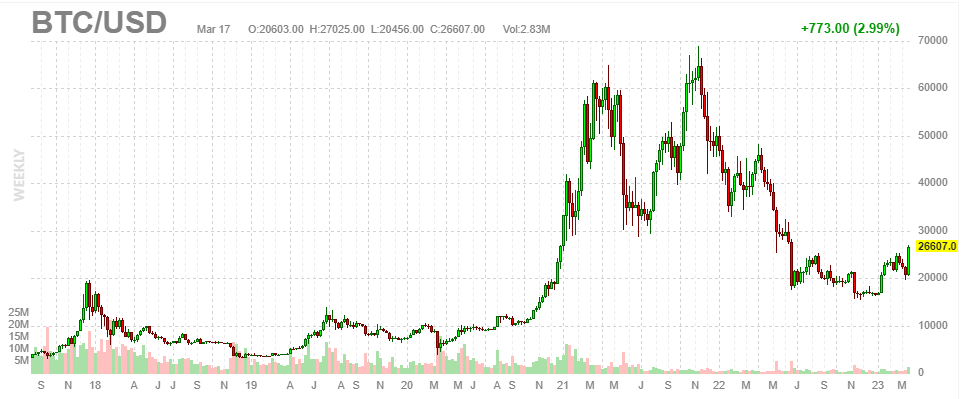
In the last week or so, we have seen a sharp decline in yield and real rates. This has caused a spike
in Gold and BitCoin prices. The fallout of Silicon Valley Bank and subsequent generosity from the FED and Treasury
has also led to a decliene in 2-year Treasuries by about 100 basis points. This risk off trade has acted
as a tailwind for Gold and BitCoin.
The recent divergence in BitCoin prices is seeing company in Gold. Even the Nasdaq is following the move upwards!
We attribute this to the recent banking crisis. In the last week or so, we have seen a sharp decline in yield and real rates. This has caused a spike
in Gold and BitCoin prices. The fallout of Silicon Valley Bank and subsequent generosity from the FED and Treasury
has also led to a decliene in 2-year Treasuries by about 100 basis points. This risk off trade has acted
as a tailwind for Gold and BitCoin.
Inflation
In the month of February, inflation climbed by 0.6%. This has been in line with consensus expectations.
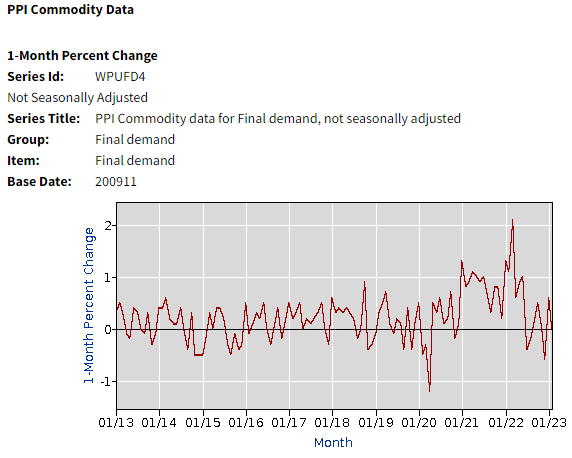
PPI, however, has remained muted with a 0% rise in February.
If you believe the rise in inflation was transitory, here is a comforting chart. Many believe the cause
of inflation was due to supply side constraints caused by COVID shutdowns across the world. This chart tracks
the pressure on global supply chain. Clearly, according to this data, the pressures have been coming down and are
now close to 0
of the normal pressure.
This chart has continued its trajectory downward.
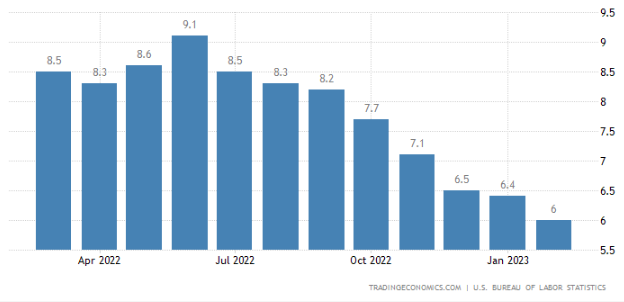
This is the headline inflation number that everyone talks about. Currently, for February 2023 we are at 6.0%.
Inflation is known to be sticky. The current trajectory is still promising and there is no need to give up
hope yet.
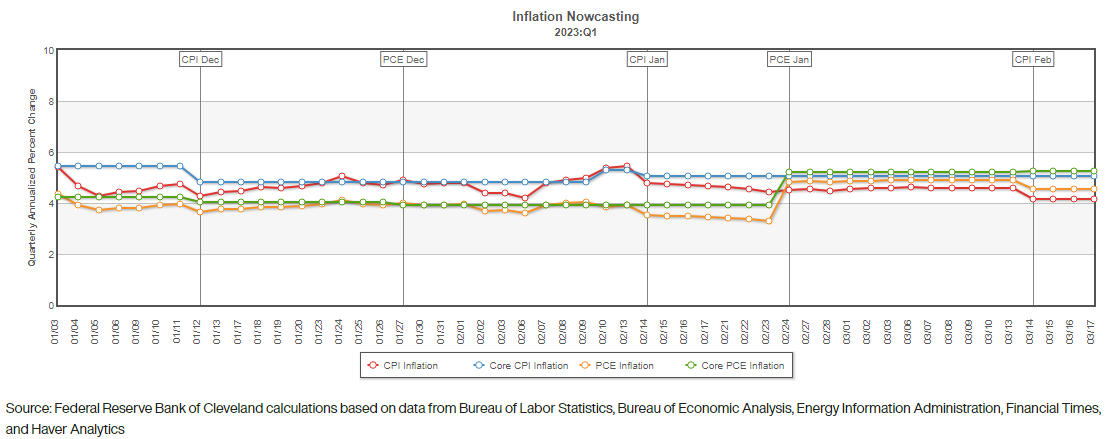
Inflation Nowcast is built using other economic indicators besides the Inflation report to come up with the latest CPI number.
Thus, it gives a more up-to-date picture on what the CPI is at any given time. Per the Nowcast, it is interesting
to see that headline CPI has remained below core CPI for two months in a row indicating the cooling in gas and food prices while the core part of the inflation
has remained fairly sticky.
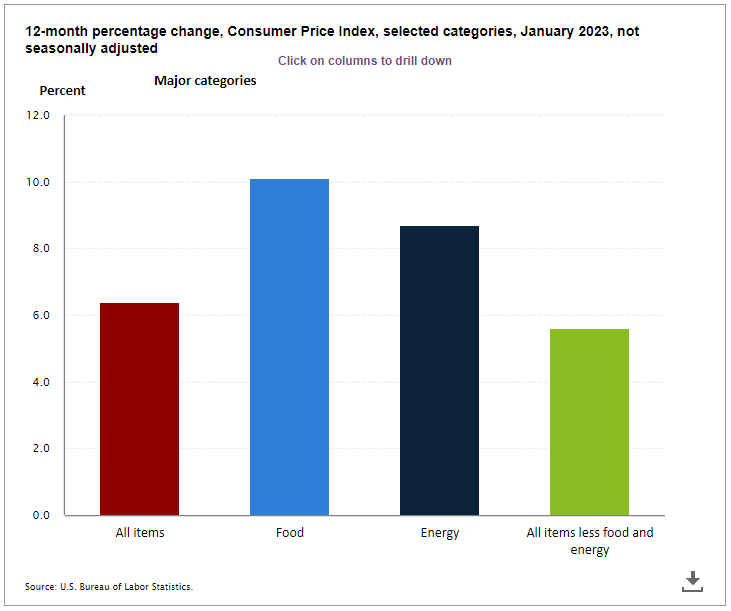
CPI Components Last Month
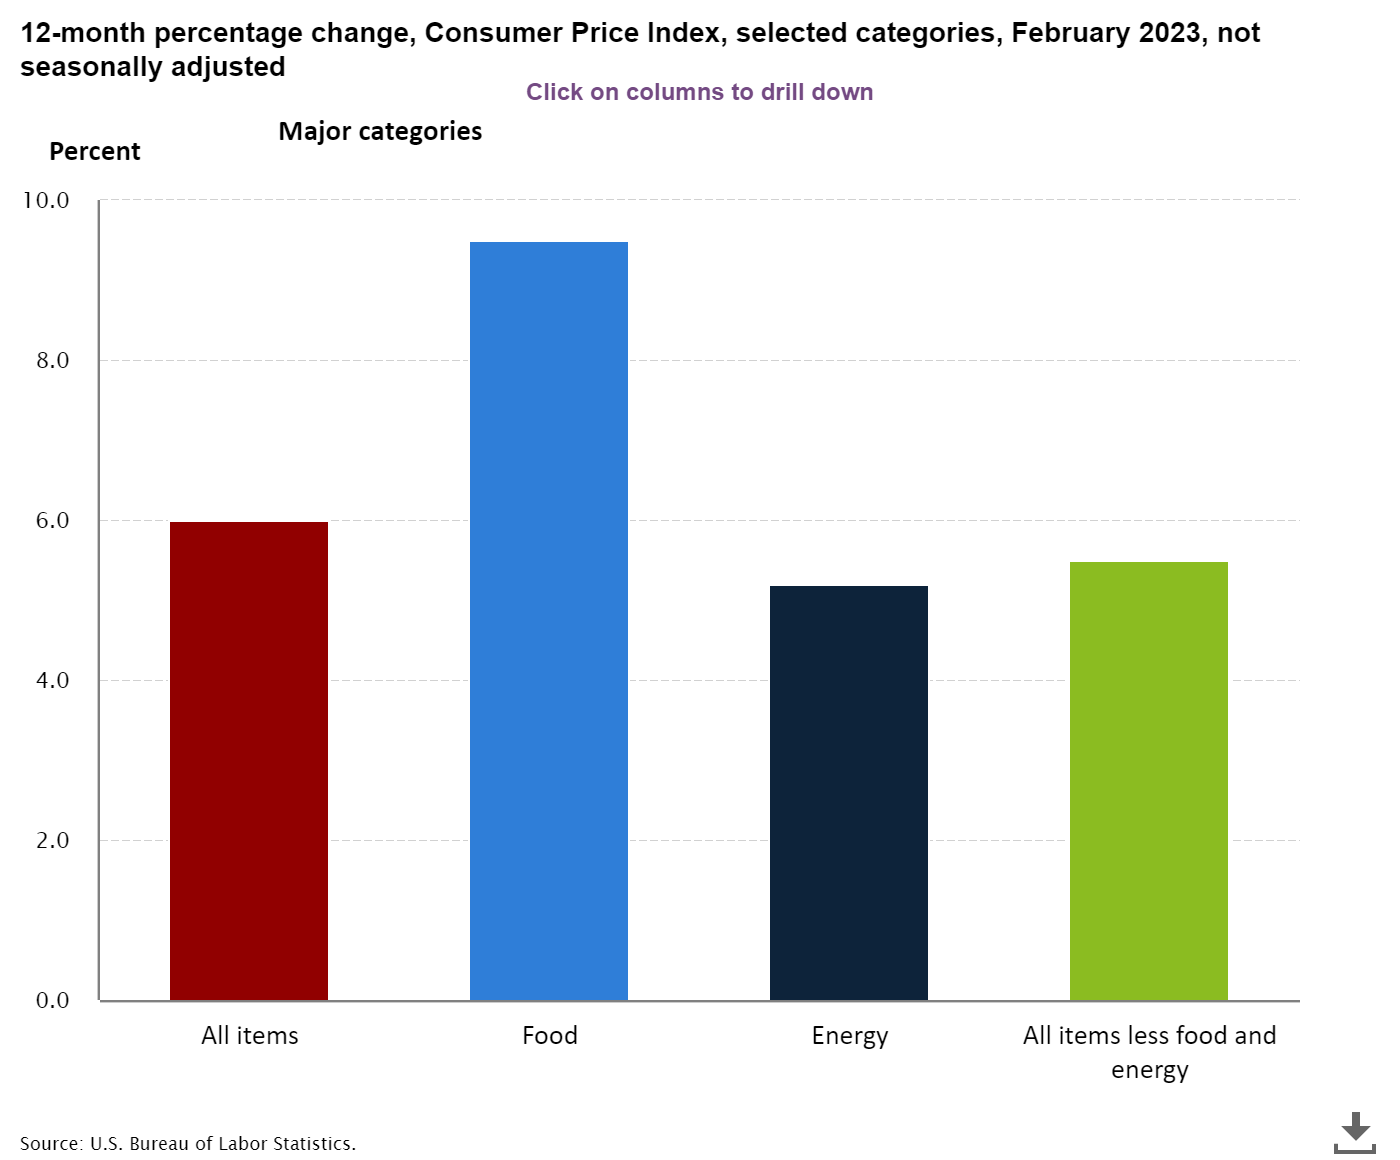
CPI Components This Month
Food and energy inflation has come down significantly. Energy inflation is now gone below inflation on
all other items as the oil prices have continued their decline.
(Please note that the y-axis in both the graphs have different scales).
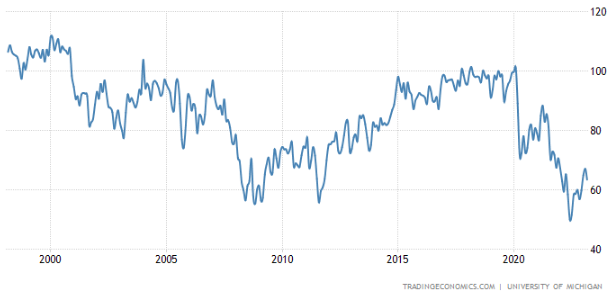
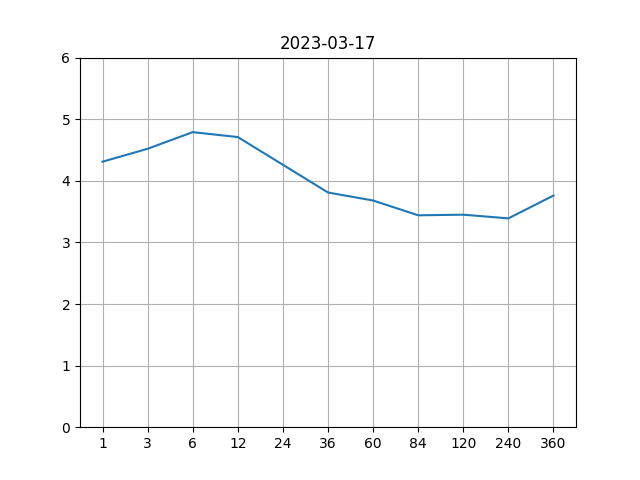
This survey data shows that inflation one year from now is expected to be 3.8%, a good decline from the reading
last month of 4.2%.
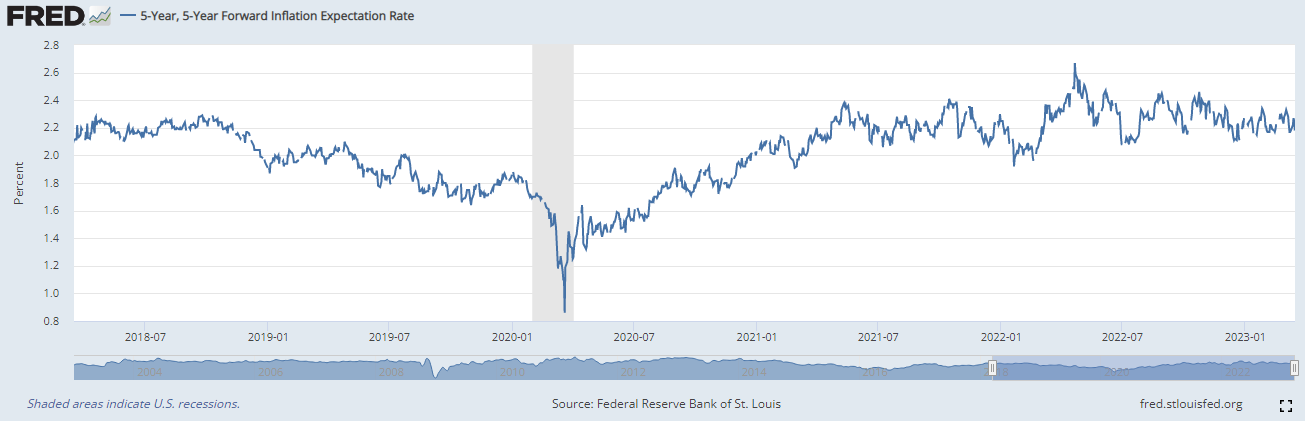
This is a market based indicator showing the inflation in 5 year forward interest rate, 5 years, is in a 2
handleIf a measure such as stock price ranges in 35.01 through 35.99, the stock price is said to have a handle of 35.
.
This indicates the current inflation bout is just a blip in the radar and not an indicative of a structural change in the
economy.
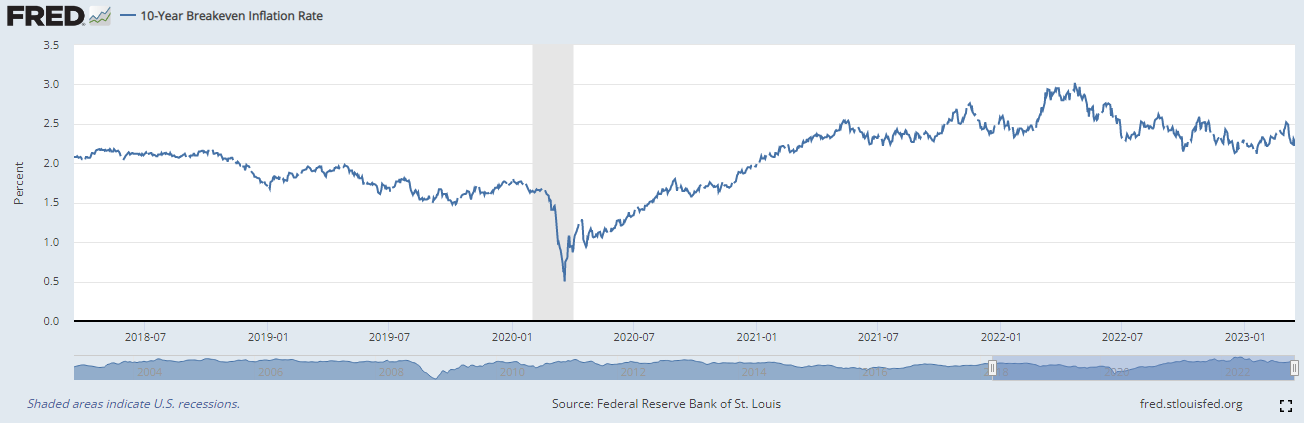
This is another market based indicator showing the inflation 10 years from now is in a 2
handleIf a measure such as stock price ranges in 35.01 through 35.99, the stock price is said to have a handle of 35.
.
This indicates the current inflation bout is just a blip in the radar and not an indicative of a structural change in the economy.
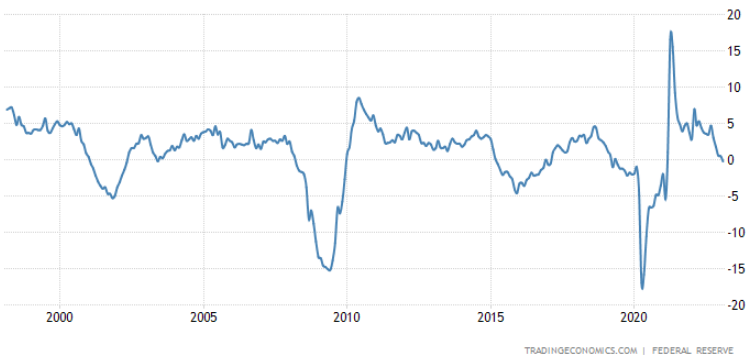
It is great to see real yields in the positive territory after a long period of being on the negative side.
This indicates the optimism in bonds where you can make some positive
carryYield on the investment.
.
Also, you can notice the sharp turn down in the last week since the banking crisis got started. We hope
it holds the resistance level slightly above 1%.
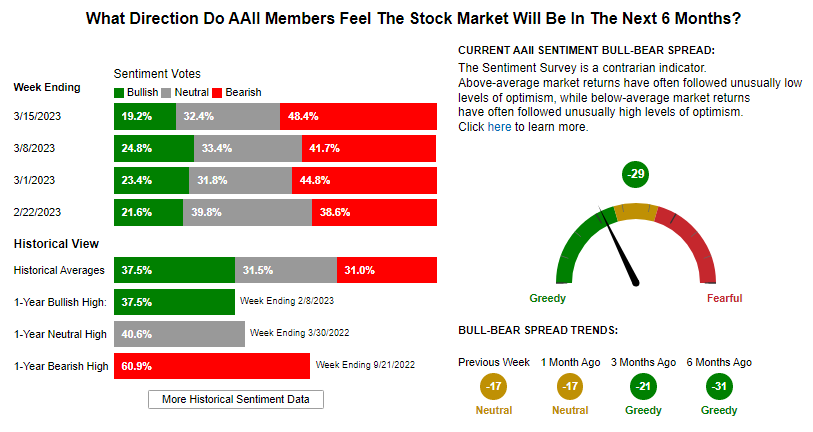
Sentiments
The survey indicator for consumer sentiments remains just fine. It is good to see it has not declined considerably
after the January effect last month.
The investors have remained bearish for a while. The new facilities at the FED to backstop the banking
crisis could act as a shot in the arm and lead to a dash for trash stocks. Our opinion is that it would be
short-lived as we see strong signs of a slowing economy.
GDP Factors
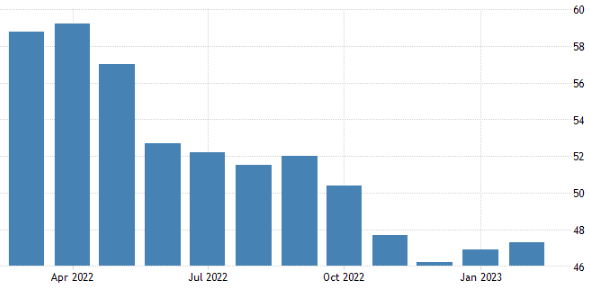
Manufacturing PMI reading indicates a contraction (below 50) which is not great and does not share the Atlanta
FED optimism on GDP growth. More so, this may indicate the slowdown in the economy that is yet to come. However,
this month, we are seeing a bump to the positive side and we hope it builds up.
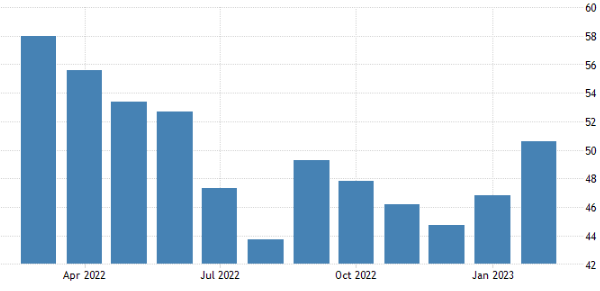
Services PMI reading has pushed past 50. Many are jumping to the conclusion that this may
indicate a soft or no landing scenario, essentially implying that we may avoid a recession.
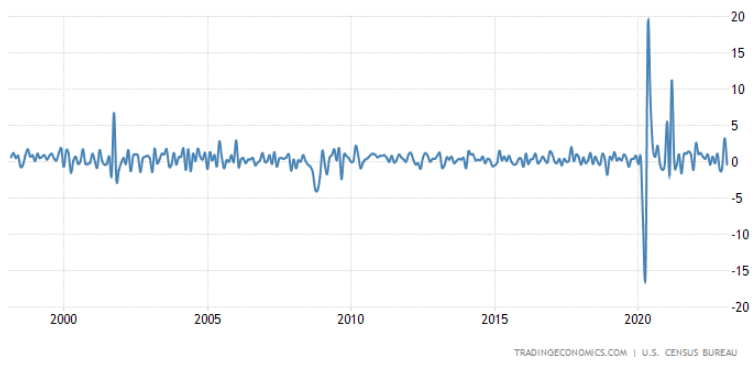
Industrial Production has turned negative this month, but close to zero.
Retail Sales has also turned negative. Perhaps the holiday sales lacuna is a reason.
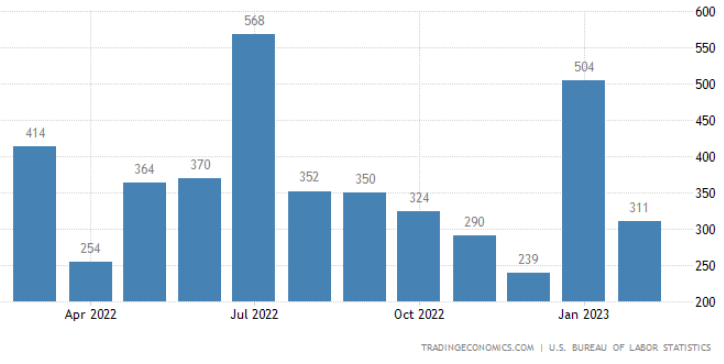
Non-farm payrolls have stubbornly been too good indicating economy is still adding jobs. This month again, the jobs number broke
the consensus expectation by a good margin. While there are layoffs taking place in Tech land, the economy quietly has been
adding so many jobs! If jobs are plenty and unemployment is record low, there can be no recession. This just makes FED's job
so much harder.
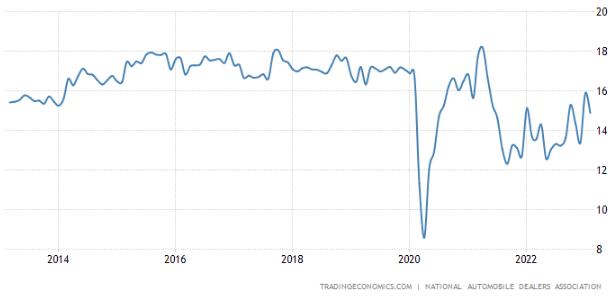
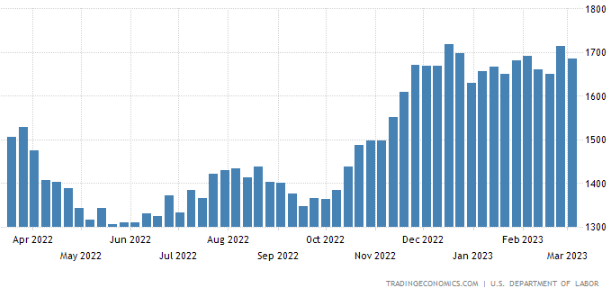
Total Vehicle sales continues to be within its trend band higher.
The used car prices are starting to inch up again seemingly the demand is coming back up.
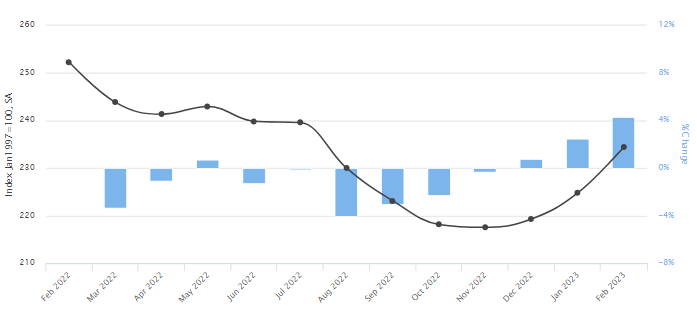
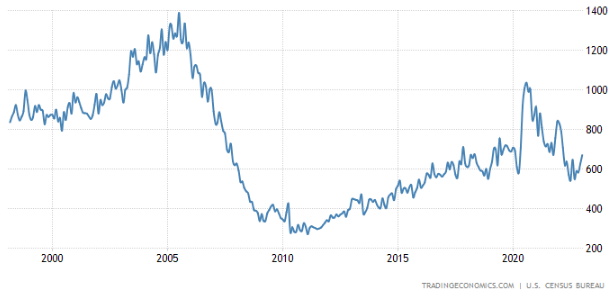
New home sales are starting to tick up again. Perhaps new buyers are feeling courageous to take on the higher
mortgage rates thinking it may only go higher in the coming months.
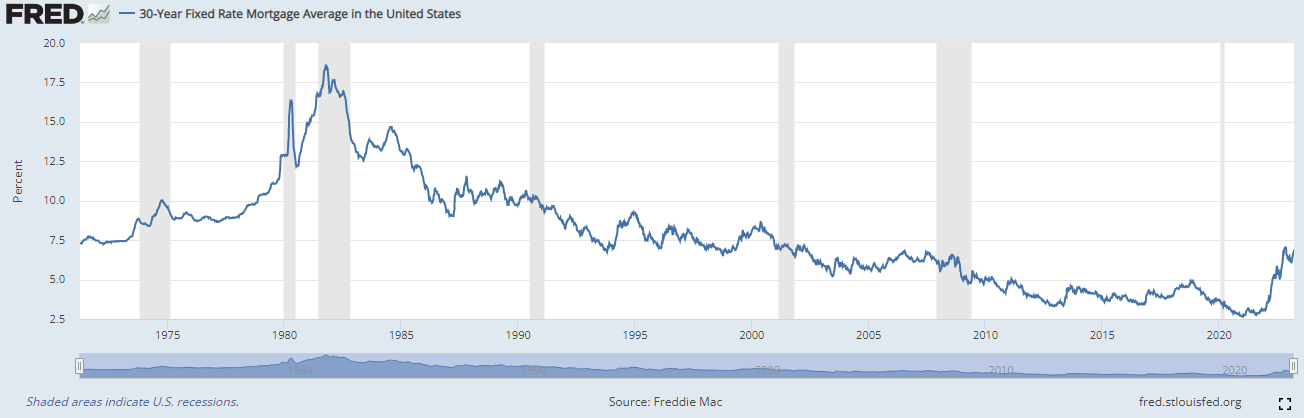
The mortgage rates are stabilizing and buyers have been coming back to the market. The housing market is showing
signs of thawing as spring has arrived.
Employment Indicators
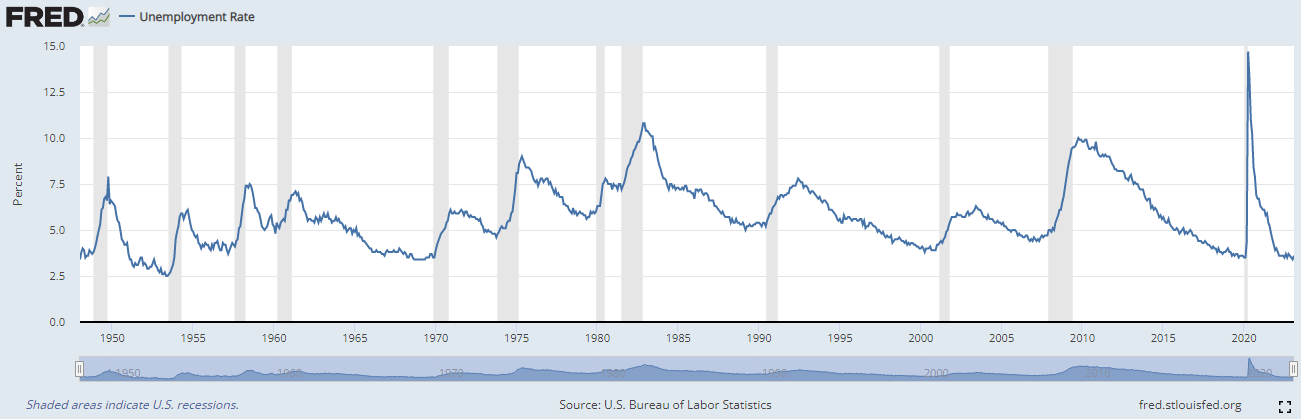
The unemployment rate has remained low despite the FED's attempt to induce a slowdown. This indicator is a lagging
indicator and we do expect to see this number creep up in the months to come.
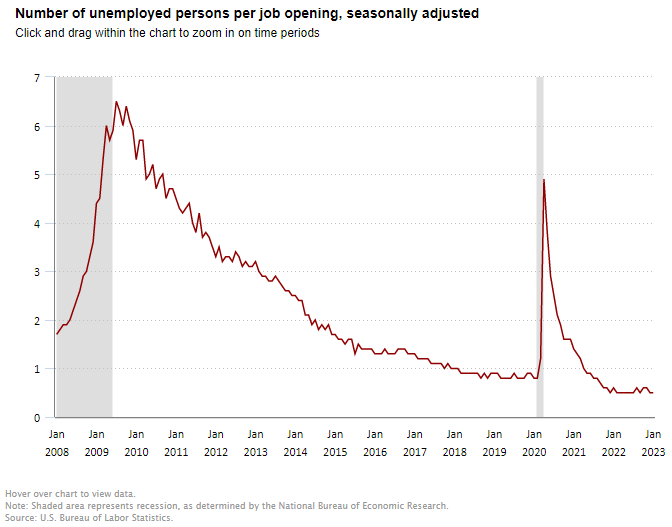
There are about 2 job openings for every unemployed person looking for a job.
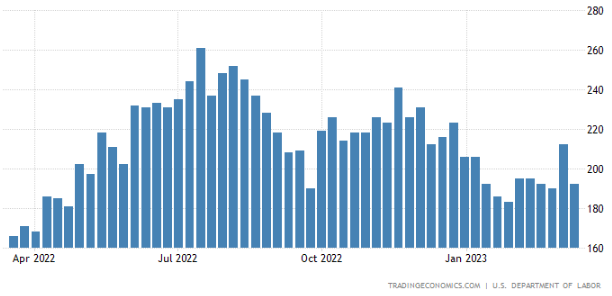
This chart will be the first indicator of a telltale sign that unemployment is increasing. As you see the continuing
jobless claims number rise, it implies the people who lost their jobs are not going back to labor force fast enough
and the unemployment rate is starting to creep higher.
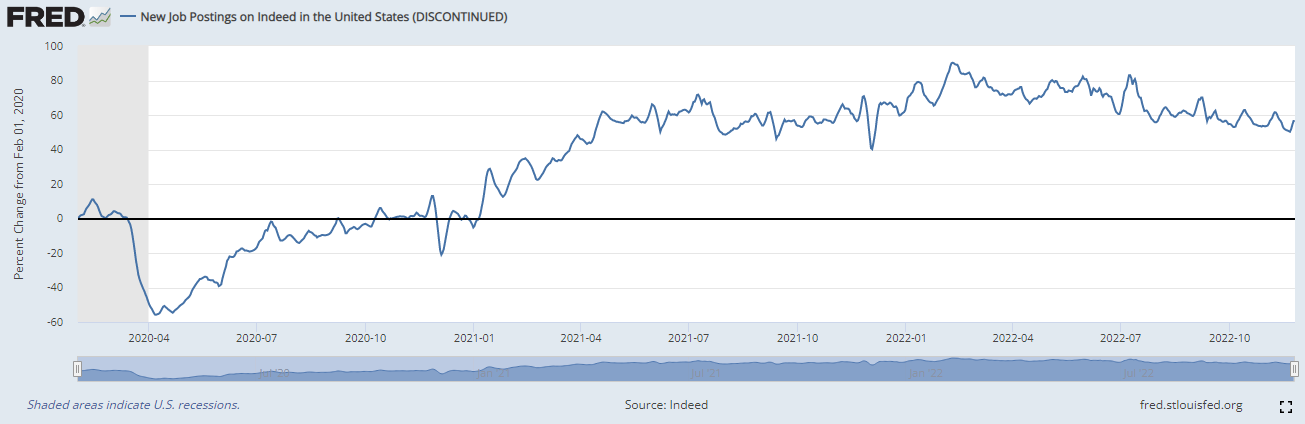
Interestingly, the rate of change in job postings is reducing but the total jobs are still rising according to
this indicator. While this is consistent with the BLS report on job openings to unemployed, we expect to see
some sharp corrections if a recession is imminent.
This month, the wage inflation is exceeding the headline inflation as it recorded a reading of 6.1% compared
to the headline inflation of 6%. This is an indication that inflation is being entrenched and may lead to
wage/price spiral. Something that the FED does not want to see.
Market Indicators
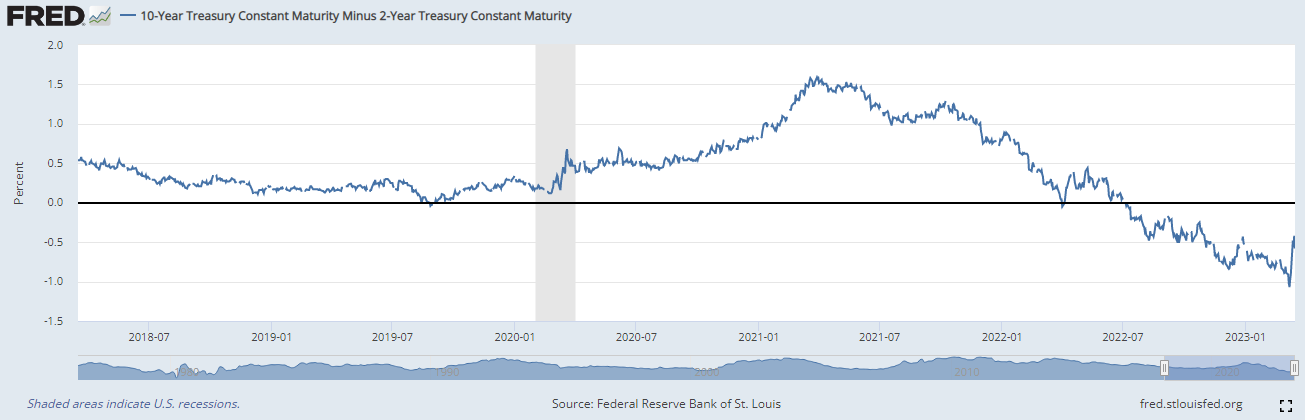
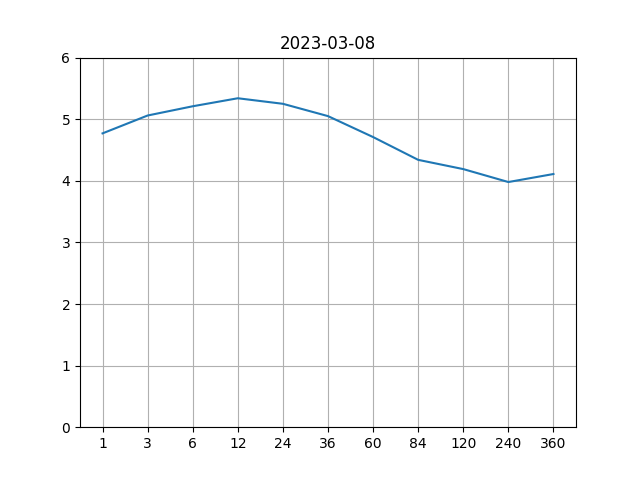
This is the big story of this month - the inverted yield curve is now suddenly trying to un-invert! Events following
the Silicon Valley Bank fallout has caused a run to haven Treasury bonds that 2-year Treasury yield have dropped by about
a percentage point in just a few days!
Jeffrey Gundlach, the bond king, in his recent
Total Return Macro Webcast is predicting that a sharpe steepening of the
yield curve after remaining inverted for some time implies that recession has almost begun.
Yield curve - Then
Yield curve - Now
Within a week's time, we are witnessing the yield curve dropping by about a percentage point around the 2-year point! As
many market participants have noted, the short term bonds have rallied more than the long term bonds and this does not happen
very often. This is seen as the last stage of the FED hiking cycle. Due to increasing interest rates, something in the system
starts breaking (read banking crisis) which inevitably leads to tightening of credit and sharp slowing of the economy. This forces
the FED to ease policy rates. The market is seeing through this dynamic and acting accordingly.
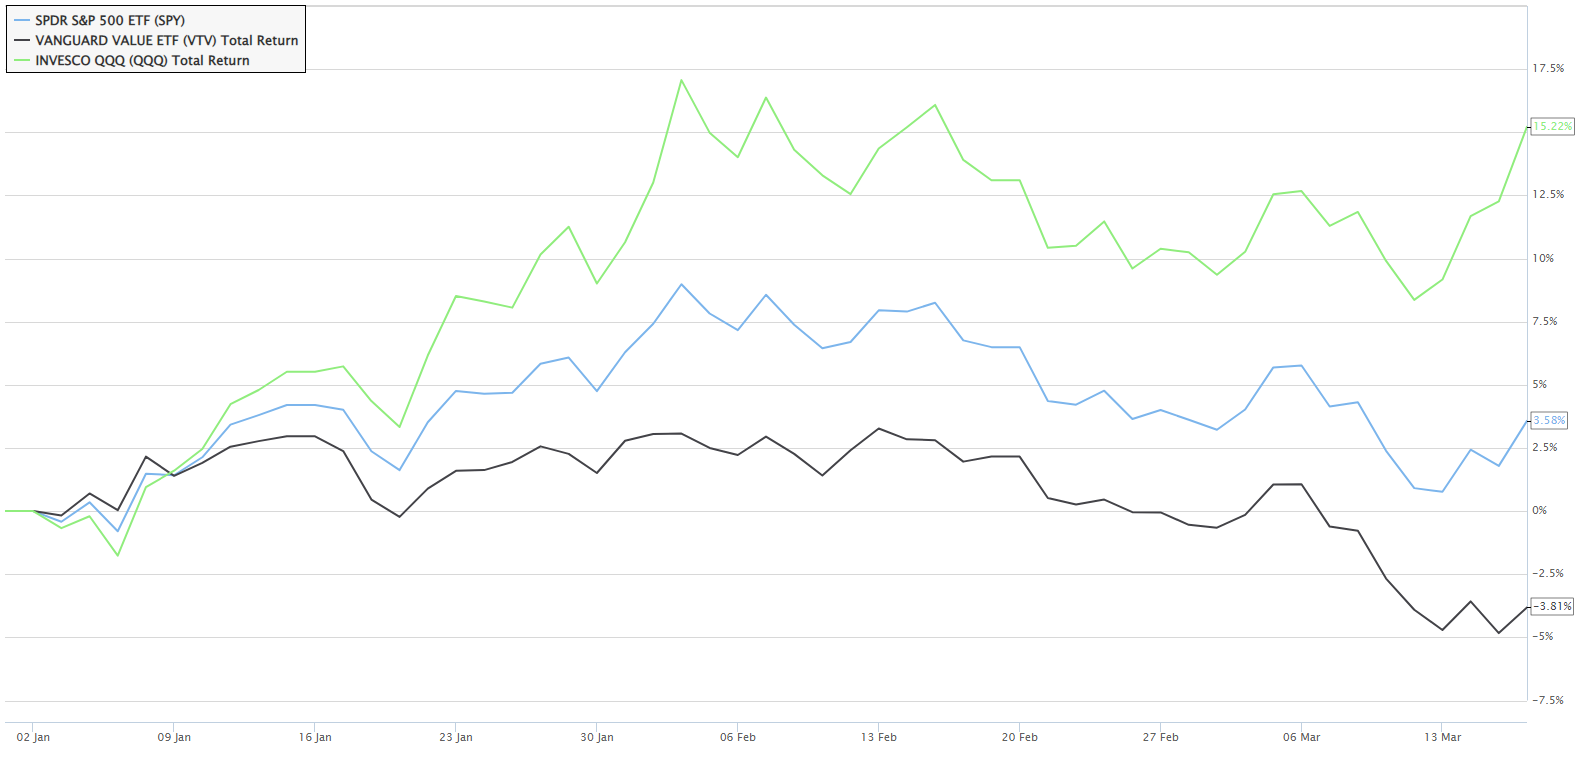
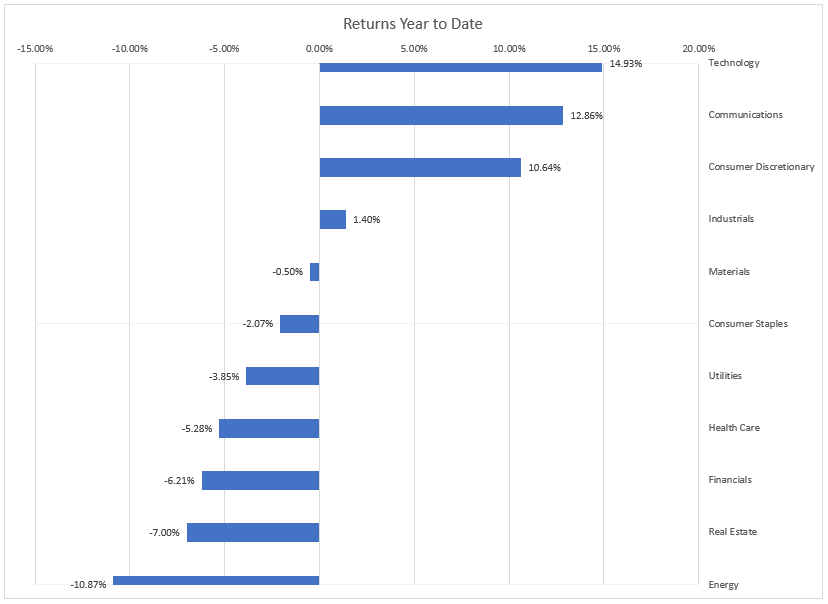
The markets have done well year to date. The earnings season has not been as dismal as expected. The companies
seem to have kicked the recession can down the road. The sectors that did badly last year have been outperforming this year.
Year to date, technology and communication sectors and back to being the leaders. Is this a dash for trash, long duration
trade back on again? Or is this for real this time? The developments in the banking sector foretells this move is short-lived.
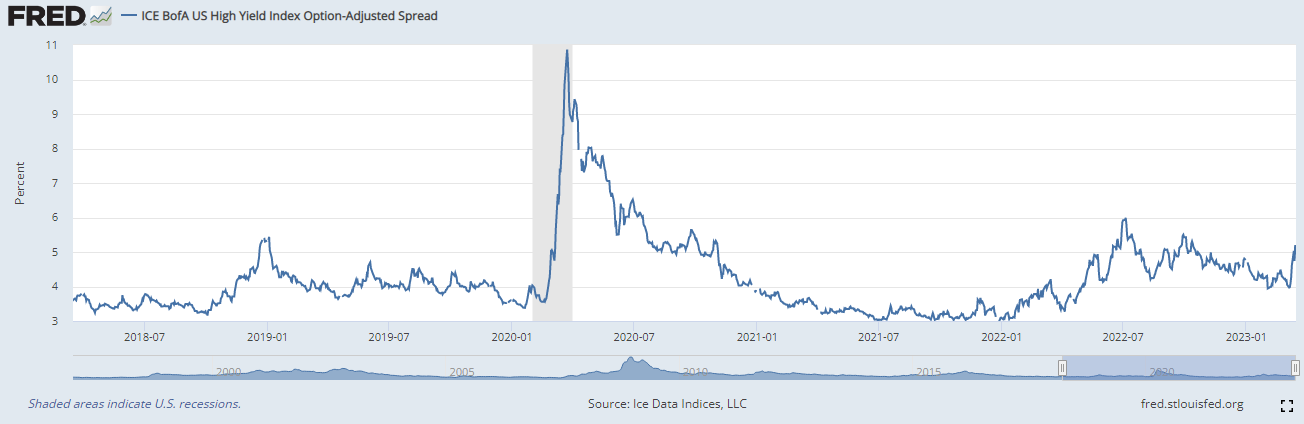
If the economy were to enter a recession, it is likely that some of the companies will struggle to keep up with
their debt payments causing their credit spread to widen. This indicator shows how the credit spreads have been
behaving so far.
In the last few days, the credit spread has widened by 100 basis points. If this marks the start of a recession,
it is likely to widen further.
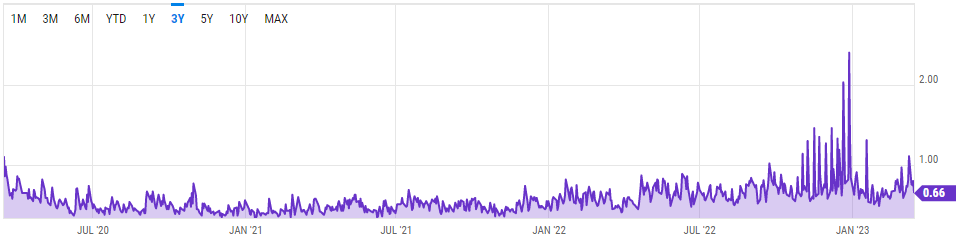
A spike in put / call ratio indicates that investors are very apprehensive about a sudden fall in the equity
markets. In March, the activity has been quite well behaved in the overall market (SPY) in spite of the turmoil
in the banking sector.
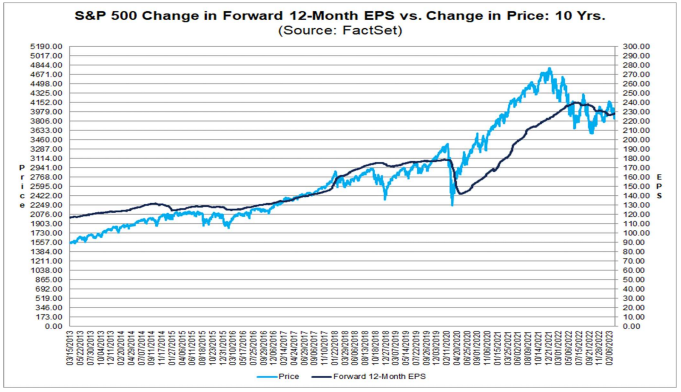
The current earnings forecast by equity analysts estimate the earnings potential for S&P 500 companies to be
around $230 which translates to a price to earnings ratio of 17.1 at the current S&P 500 price level. This
is just below the 10 year average.
It is likely that as inflation comes down, so will the earnings numbers. This indicates that the future S&P 500
price level could likely come down. Based on the companies that have reported so far,
the earnings have declined by -6.1%.
- Trillium Square Advisors LLC is a registered investment adviser offering advisory services in the state of North
Carolina and in other jurisdictions where exempted. Registration as an investment adviser does not imply a
certain level of skill or training, and the content of this communication has not been approved or verified by the
United States Security and Exchange Commission or by any state securities authority.
- Information presented is for educational purposes only and does not intend to make an offer or solicitation for
the sale or purchase of any specific securities, investments or investment strategies. Market data, articles and
other content in this presentation are based on generally available information and are believed to be reliable.
Trillium Square does not guarantee the accuracy of the information contained in this presentation. The
information is of a general nature and should not be construed as investment advice and relied upon in making
investment decisions.
- Investments involve risk and are never guaranteed. Be sure to first consult with a qualified financial adviser before
implementing any strategies discussed herein.
- Past performance is not indicative of future performance.
- The content of this communication and any accompanying documents are confidential. They are not to be copied,
excerpted or distributed without express written permission of the firm. Any other use beyond its author’s intent,
distribution or copying of the contents of this presentation is strictly prohibited. Nothing in this document is
intended to be legal, accounting, or tax advise, and is for informational purposes only.
- Hypothetical performance results have many inherent limitations. No representation is being made that any
account will or is likely to achieve profits or losses similar to those shown. In fact, there are frequently sharp
differences between hypothetical performance results and the actual results subsequently achieved by any
particular investment strategy. Hypothetical performance for illustration purposes only.
- Trillium Square will provide all prospective clients with a copy of our current Form ADV, Part 2A (Disclosure
Brochure) upon request. At anytime you can view our current Form ADV, Part 2A at https://adviserinfo.sec.gov
© Copyright Trillium Square Advisors LLC. All rights reserved.
Main Address:
Trillium Square Advisors LLC,
423 Peaslake Ct, Rolesville NC - 27571
Office Address:
Trillium Square Advisors LLC,
2840 Plaza Place, Suite 210, Raleigh, NC - 27612
Website Content
All written content on this site is for information purposes only. Opinions expressed herein are solely those of Trillium Square Advisors LLC unless otherwise specifically cited. Material presented is believed to be from reliable sources and no representations are made by our firm as to another parties’ informational accuracy or completeness. All information or ideas provided should be discussed in detail with an advisor, accountant or legal counsel prior to implementation.
This website may provide links to others for the convenience of our users. Our firm has no control over the accuracy or content of these other websites.
Registration Information
Advisory services are offered through Trillium Square Advisors LLC; an investment advisor firm domiciled in the State of North Carolina. The presence of this website on the Internet shall not be directly or indirectly interpreted as a solicitation of investment advisory services to persons of another jurisdiction unless otherwise permitted by statute.
Follow-up or individualized responses to consumers in a particular state by our firm in the rendering of personalized investment advice for compensation shall not be made without our first complying with jurisdiction requirements or pursuant to an applicable state exemption.
For information concerning the status or disciplinary history of a broker-dealer, investment advisor, or their representatives, a consumer should contact their state securities administrator.