Summary
Calm before the Storm - when do we start seeing the volatility?
There has been a number of market moving news in the last week or so. Yet, the markets have been benign and
fairly calm. The big news that awaits the markets now is on how the debt ceiling gets resolved. The bond market volatility
is currently limited to the very short end of the curve. Would this also trigger
volatility in the equity markets?
Economic news over the month has been faily positive or neutral. Some of the factors of production such
as the manufacturing and services PMIs have been inching upwards. The inflation numbers are inline with
expectations. The non-farm payroll numbers are healthy and positive. These are indicating optimism for soft landing.
Where can the surprise come from? Debt ceiling debate is an obvious candidate. The last time that this debate
got so heated was in 2011 when the markets saw higher volatility and equity markets sold off. There was a coincident
sovereign debt crisis in Europe. This time, we don't seem to have many complications outside the debt ceiling
debate. Perhaps the can just gets kicked down the road making this a problem to be solved some other day in the future.
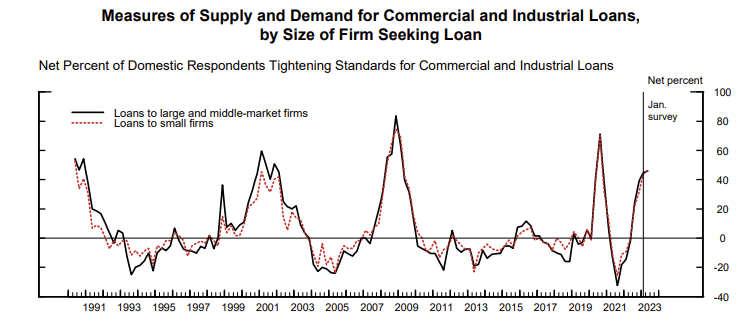
The real surprise is likely somewhere hidden in the credit markets. The regional banking crisis seems to be still
simmering, potentially tightening up lending and impacting the commercial and industrial refinancing market. This is
evident in the Senior Loan Officer Opinion Survey. While most loans are coming due in 2025, if a few large real estate
firms default, it is easy to see how it can trigger a domino effect impacting the broader labor markets. Whether such
an event happens or when it is likely to happen is anyone's guess.
Broad Indicators
The story of this month in one chart is the SLOOS report (Senior Loan Officer Opinion Survey). The number of
respondents tightening standards for lending C&I loans is inching towards recession levels seen in 2001, 2008
and 2020.
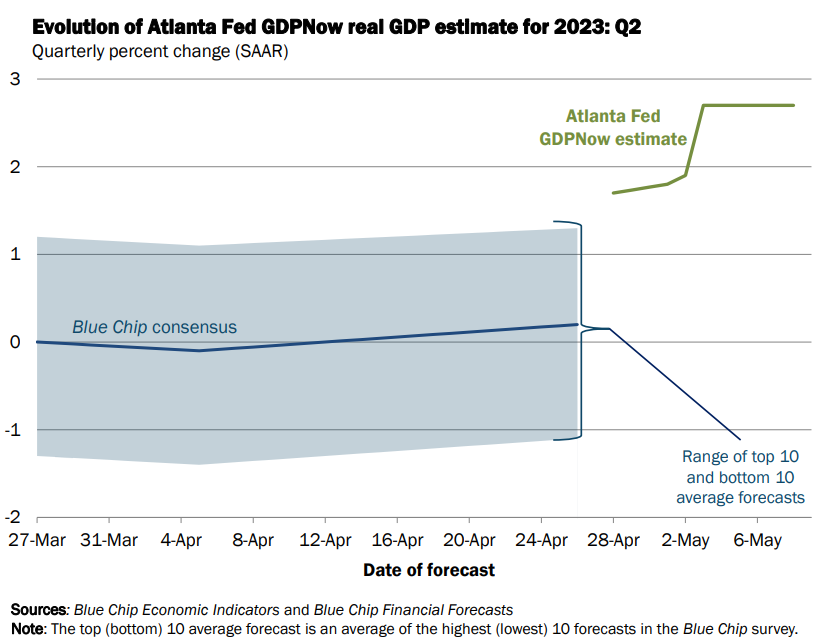
GDP is currently projected to be 2+% for Q2 2023. Even the blue chip consensus forecast have climbed higher not
withstanding the deposit crisis in banking. Clearly, this is in spite of the deposit crisis at regional banks and
the subsequent tightening in credit. The economy seems resilient at least so far.
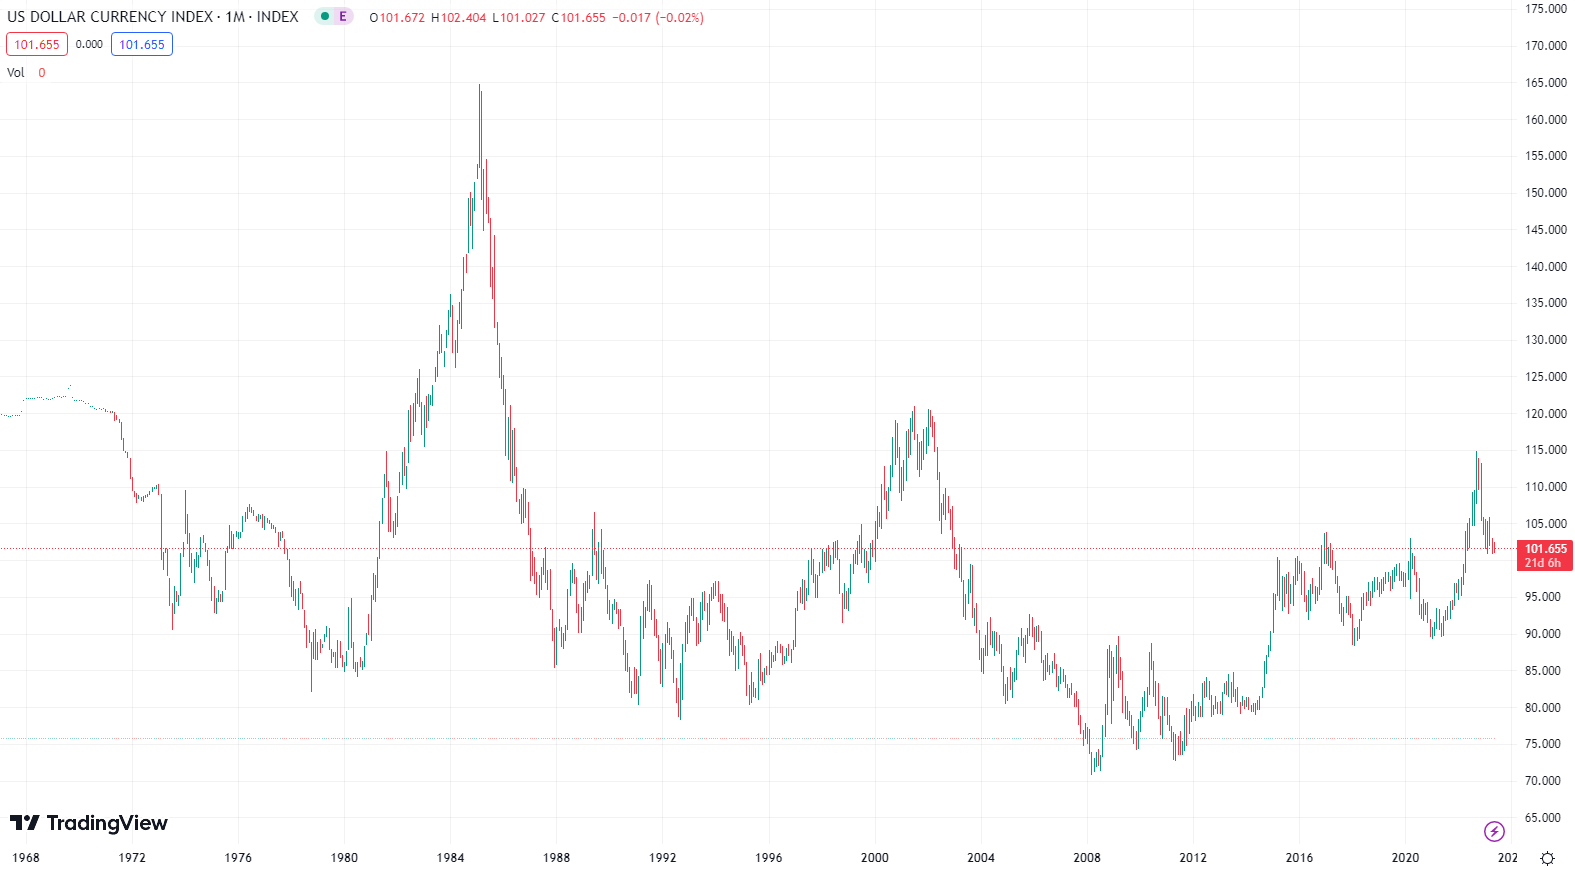
The dollar has continued to soften. More likely than not, it is attributable to the hint of FED pause as other
central banks around the world still continue to tighten policy rates.
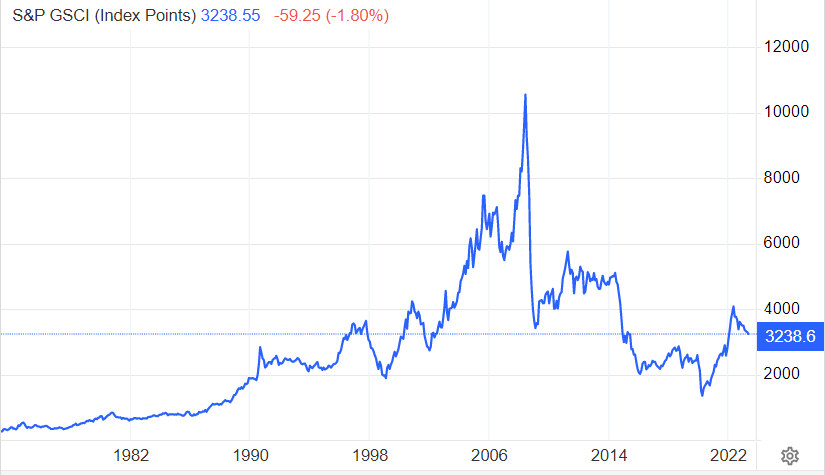
Broadly, commodities remain flat to down this month as well. Energy continues to contribute constructively to
bring inflation down.
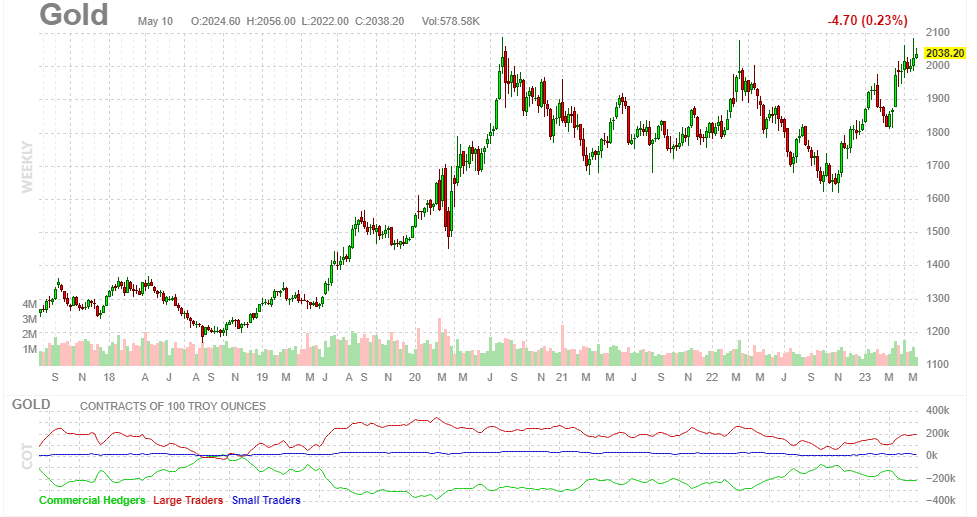
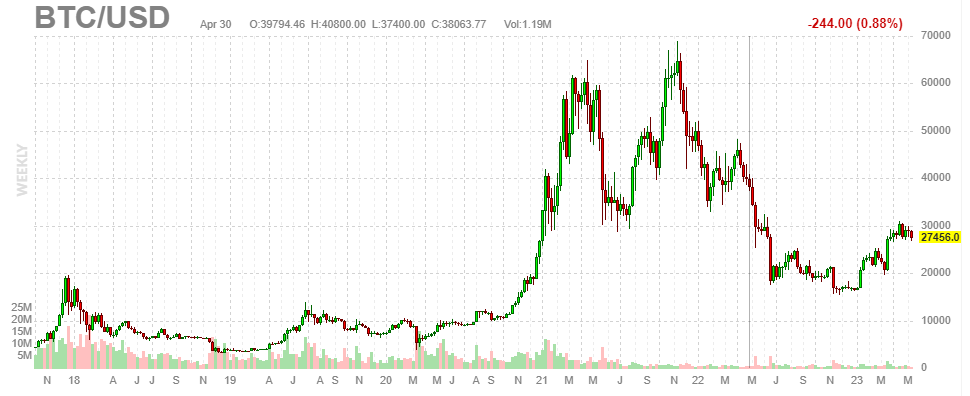
Gold and Bitcoin have continued their climb. The FED pause and rates peaking has certainly helped. The market may be acknowledging the potential of a slowing dollar.
Another key influencer is the debt ceiling debate which help to provide a solid floor for Gold and Bitcoin prices.
Same comment as above in Gold.
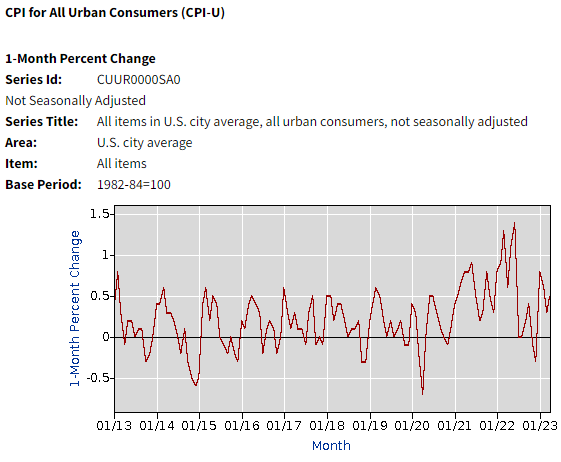
Inflation
In the month of April, inflation climbed by 0.4%. This has been in line with consensus expectations.
PPI, however, has followed CPI up by 0.2% in April. PPI has been bobbing in the positive and negative territory lately.
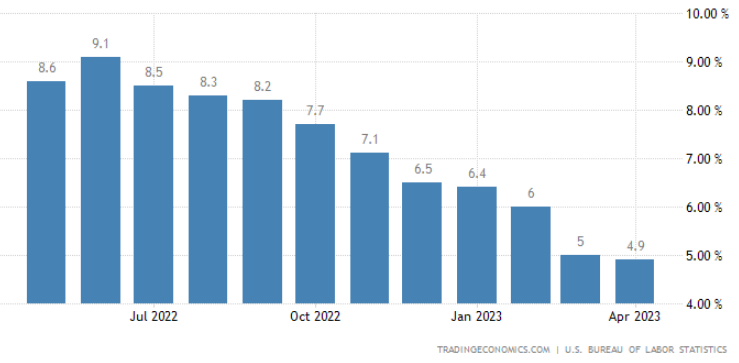
This is the headline inflation number that everyone talks about. Currently, for April 2023 we are at 4.9%. We are certainly
going in the right direction. This does not give FED any reason to hike next month.
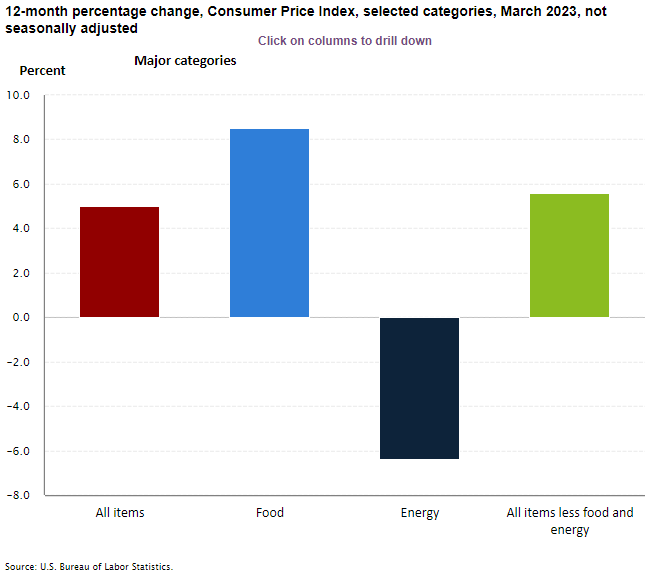
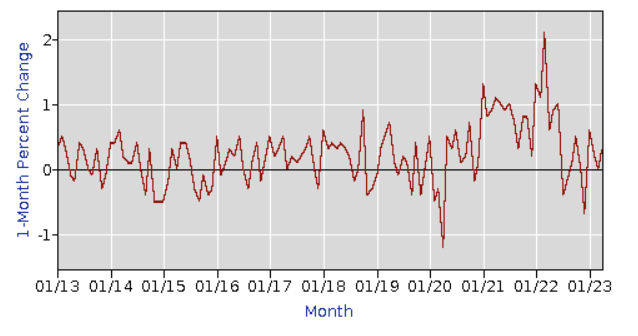
CPI Components Last Month
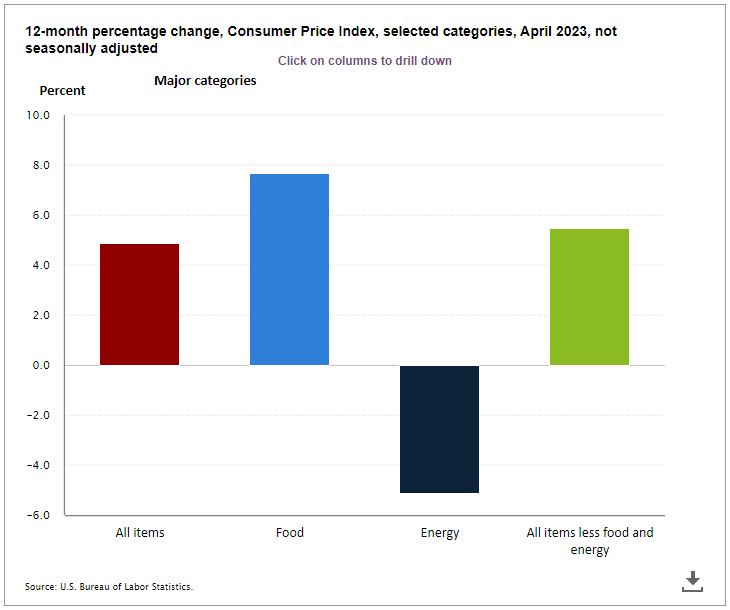
CPI Components This Month
All components of inflation are seen moderating. As mentioned earlier, energy's contribution to inflation
is negative again this month!
(Please note that the y-axis in both the graphs have different scales).
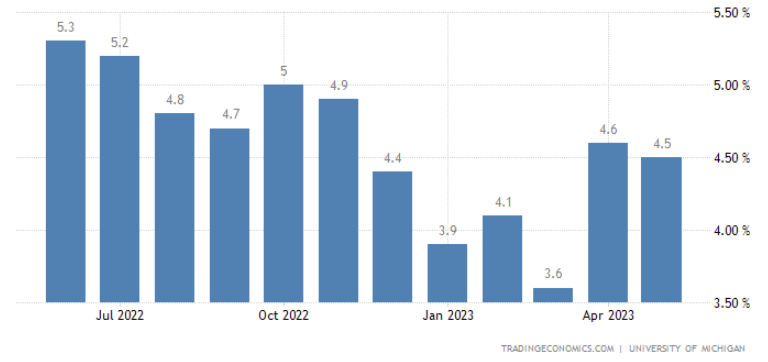
This survey data shows that inflation one year from now is expected to be 4.5%. This is the same as where the inflation
is right now. So, does it imply inflation remains flat from here on? We doubt that, perhaps the survey data may moderate
the inflation expectation in the coming months.
Sentiments
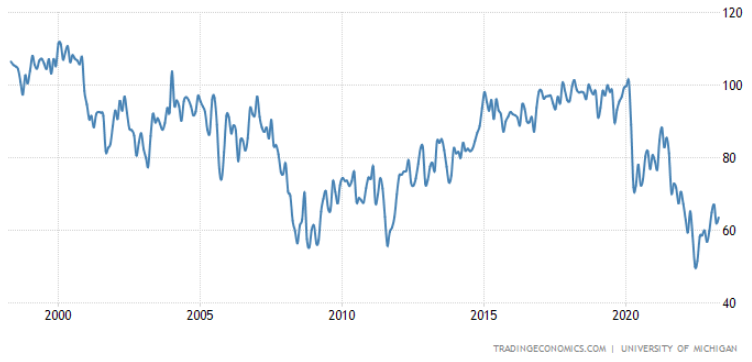
It is great to see the consumer sentiments still holding on strong above 60 consistently. As long as the
consumer is strong, it is hard to make a case we are in recession.
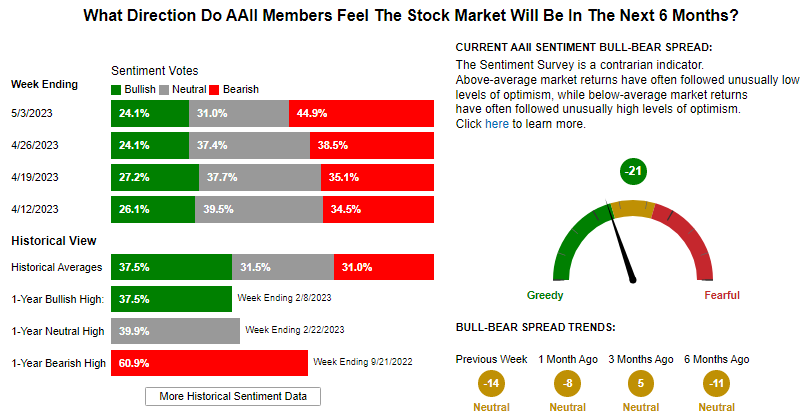
The last few weeks have seen many market moving news with FED decision, non-farm payrolls report, CPI/PPI report
and so on. Yet, the markets have been rather calm and mildly selling off. The debt ceiling debate is probably
weighing in on the markets.
The earning season has been pretty mild. We expected earnings to fall a lot, but they only fell by around 2%. Once
the debt ceiling debate is behind us, perhaps the market may turn optimistic. We hope so and so does this indicator.
GDP Factors
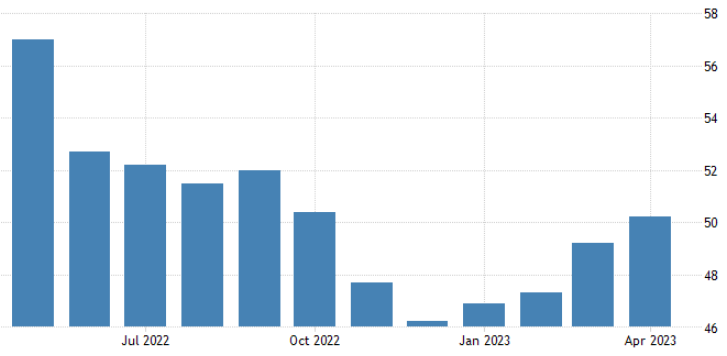
Manufacturing PMI reading bounced a bit from last month now moving above 50 indicates an expansion and shares the Atlanta
FED's optimism on GDP growth. Perhaps this is indicating the soft landing we all desire.
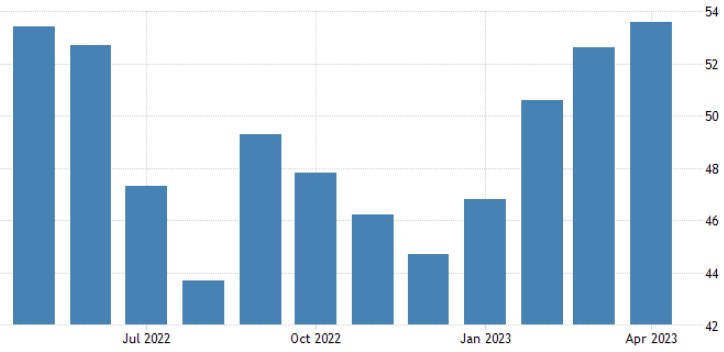
Services PMI reading has pushed past 50 and continues the trend from last month. This is again supporting
the soft landing thesis that the economy may not see a serious recession.
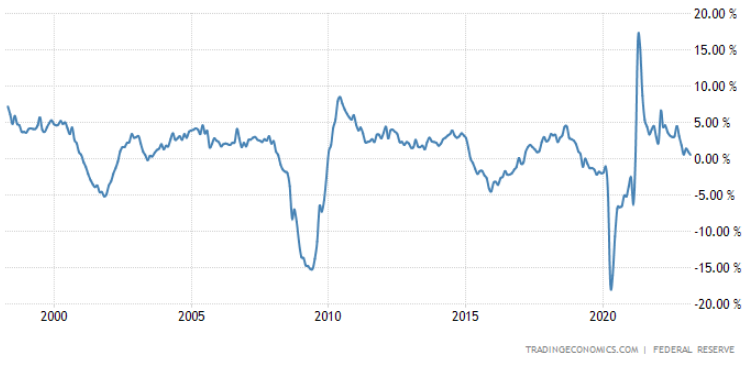
Industrial Production refuses to show the optimism seen in the manufacturing and services PMI numbers. It is
still close to 0.
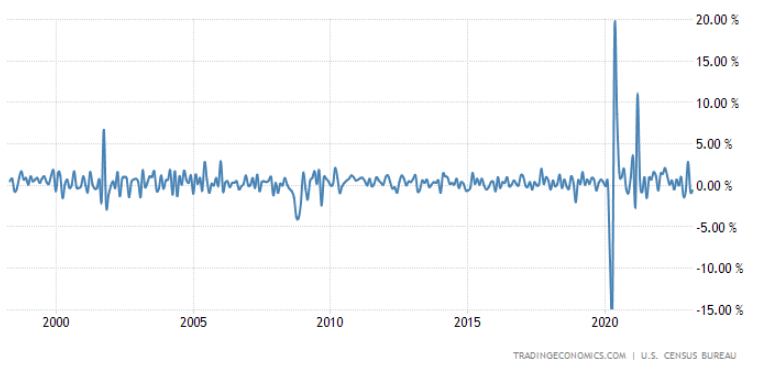
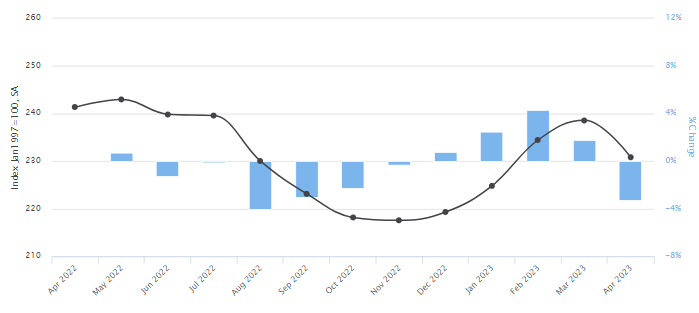
Retail Sales has remained negative in the last three months in a row. It is still mildly negative and does not
indicate the kind of major dips we see when there are pervasive job losses.
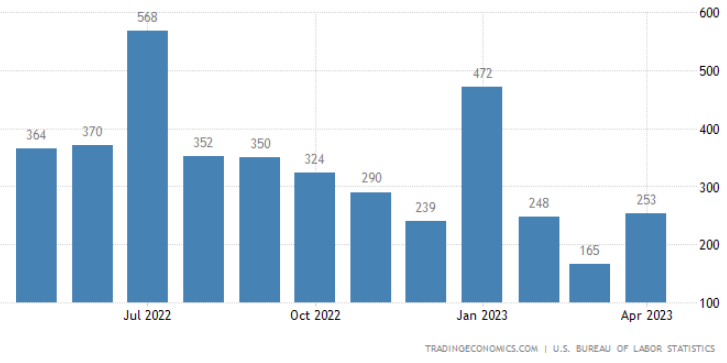
Non-farm payrolls have stubbornly been too good indicating economy is still adding jobs. This month the jobs
number was inline with expectation but too high to indicate any slowdown in job growth. However, the revisions
for the previous months have been negative indicating that jobs are not as healthy as one would see during the
growth phase of an economy. Over the next few months, things will become more clear.
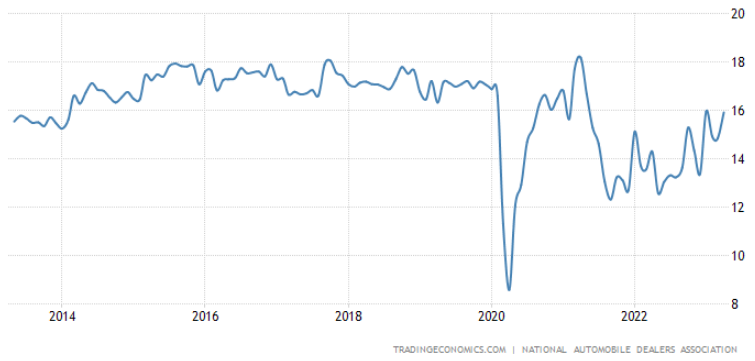
Total Vehicle sales continues to be within its trend band higher, which is a good sign. New cars are scarce in dealer lots.
The used car prices dipped 4% lower last month.
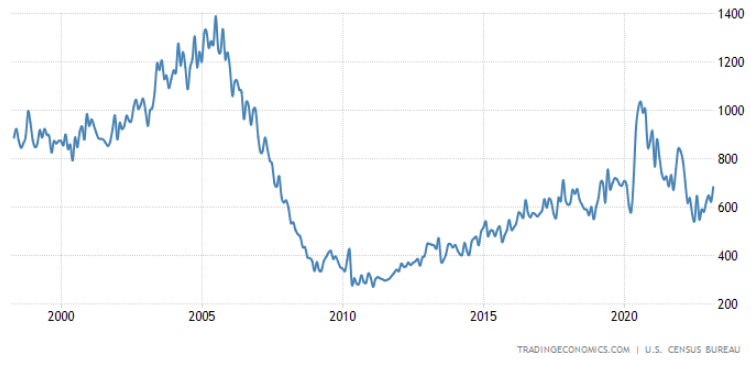
New home sales are starting to tick up again. Perhaps new buyers are feeling courageous to take on the higher
mortgage rates thinking it may only go higher in the coming months.
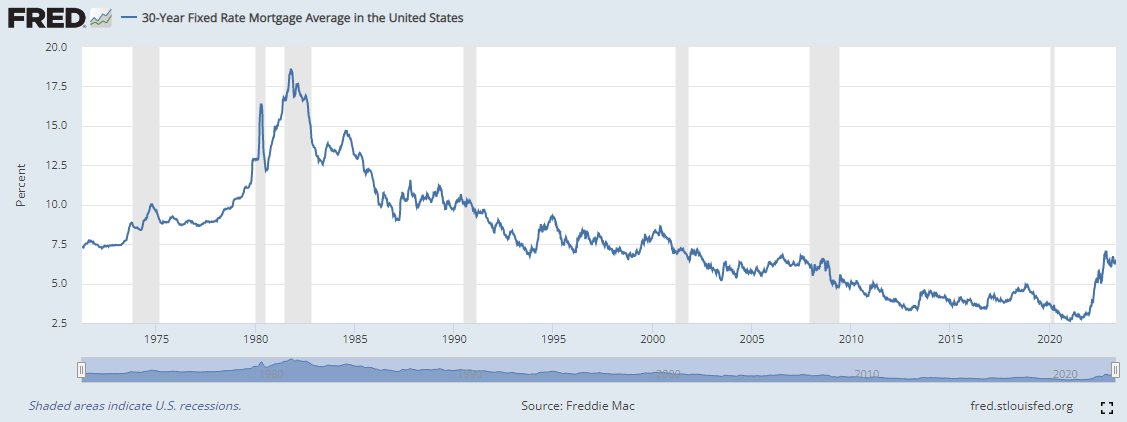
The mortgage rates are stabilizing and buyers have been coming back to the market. The housing market is showing
signs of thawing as spring has arrived.
While stabilizing, the current rate level at around 7% is causing many families wanting to trade-up, to instead stay
put in homes that have mortgages at rates in the low 3% range. This is causing some uncertainty when reading housing
activity statistics, as this rise in mortgage rates is the fastest on record, with no exact historic precedent.
Employment Indicators
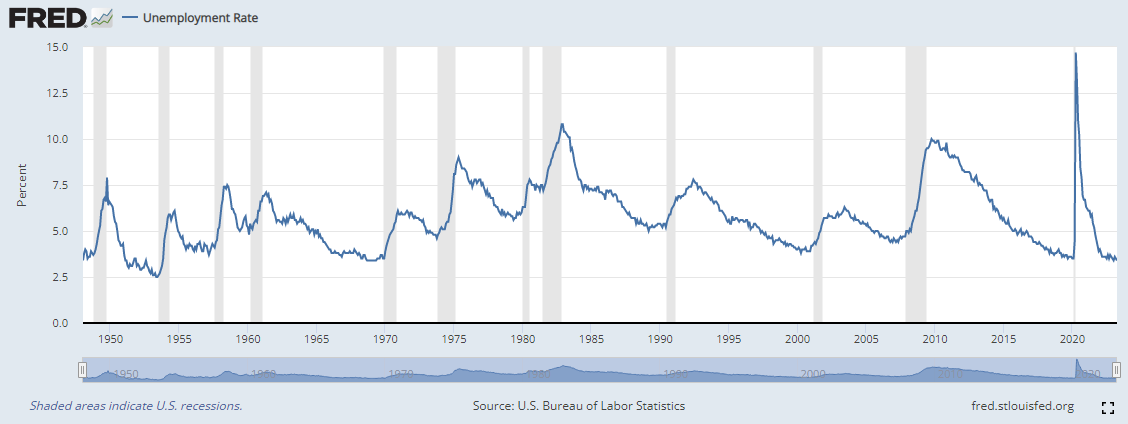
The unemployment rate has remained low despite the FED's attempt to induce a slowdown. This indicator is a lagging
indicator and we do expect to see this number creep up as recession becomes imminent.
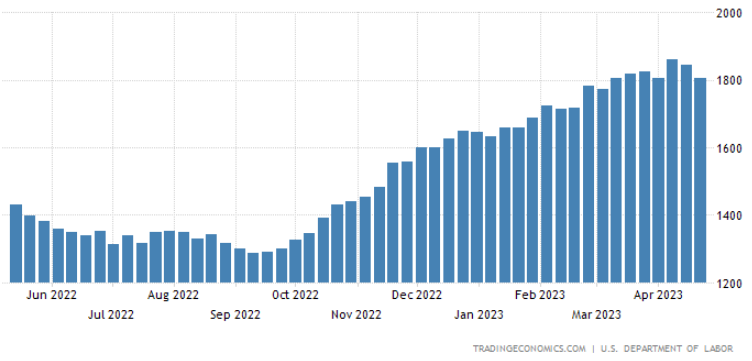
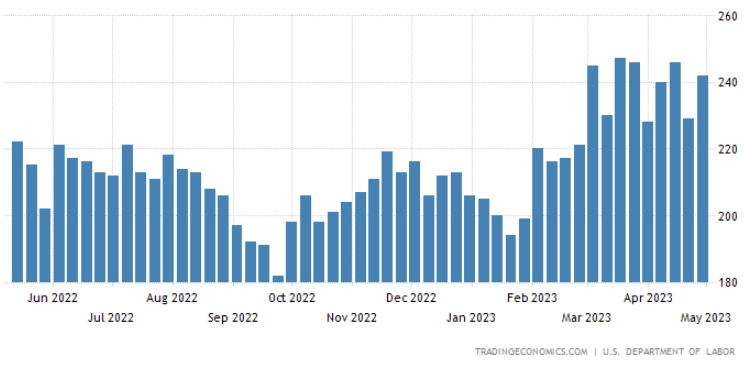
This chart will be the first indicator of a telltale sign that unemployment is increasing. As you see the continuing
jobless claims number rise, it implies the people who lost their jobs are not going back to labor force fast enough
and the unemployment rate is starting to creep higher. Over the last couple of weeks, it has trended lower. Looking at
my linkedIn feed, I see many starting new positions. Another indicator for soft landing, but it is probably premature to
make that claim with this indicator.
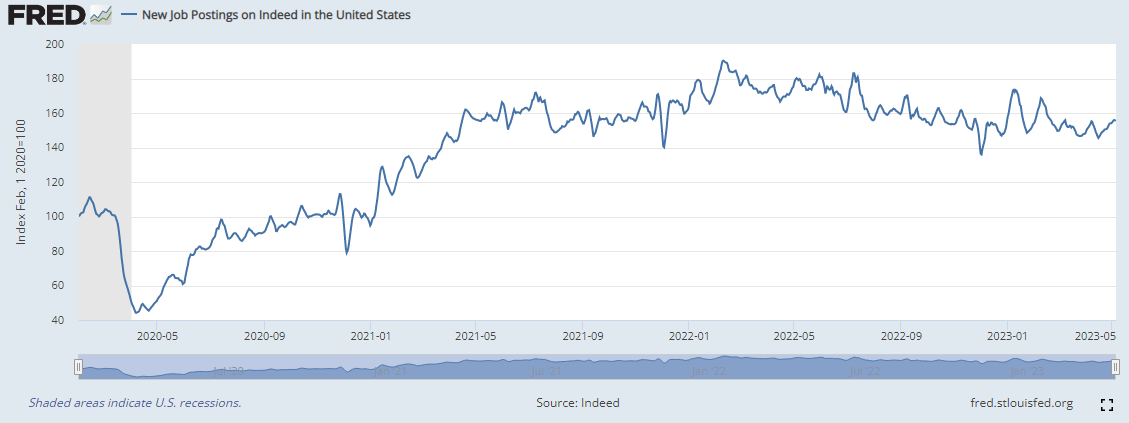
Interestingly, the rate of change in job postings is reducing but the total jobs are still rising according to
this indicator. While this is consistent with the Bureau of Labor Statistics (BLS) report on job openings to unemployed, we expect to see
some sharp corrections if a recession is imminent.
This month, the wage inflation is exceeding the headline inflation as it recorded a reading of 6.1% compared
to the headline inflation of 4.9%. This is an indication that inflation is being entrenched and may lead to
wage/price spiral. Something that the FED does not want to see and makes it likely to keep rates higher for longer.
Market Indicators
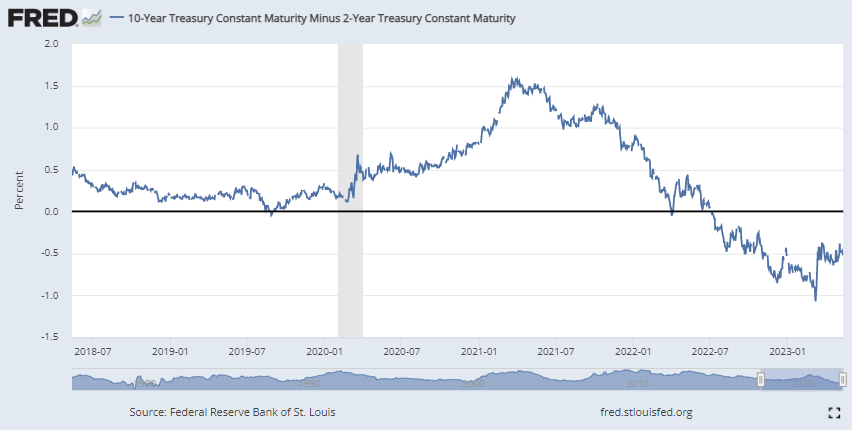
The excitement last month on the inversion in the yield curve reverting did not last long. The short and
long term yields continue to rise.
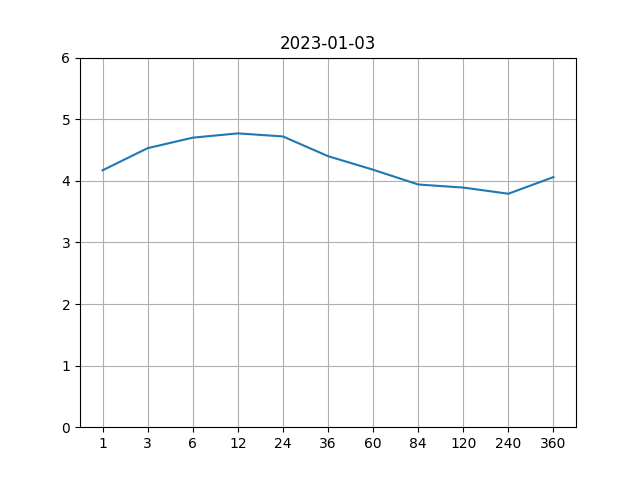
Yield curve - Then
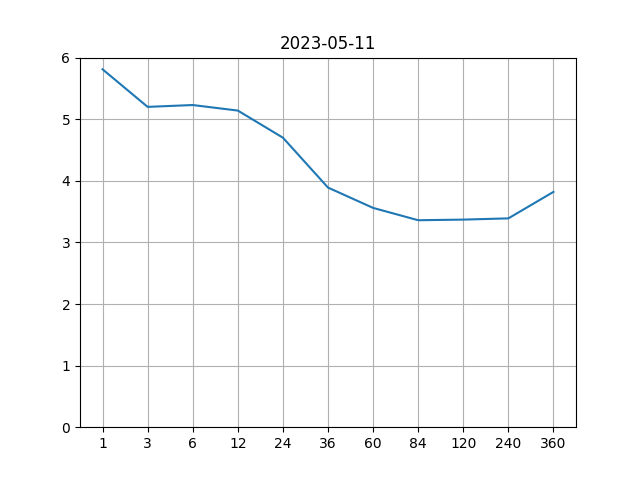
Yield curve - Now
At the very short end, you can see the 1 month bill yielding close to 6%, due to the debt ceiling debate and the
fear that US may touch technical default.
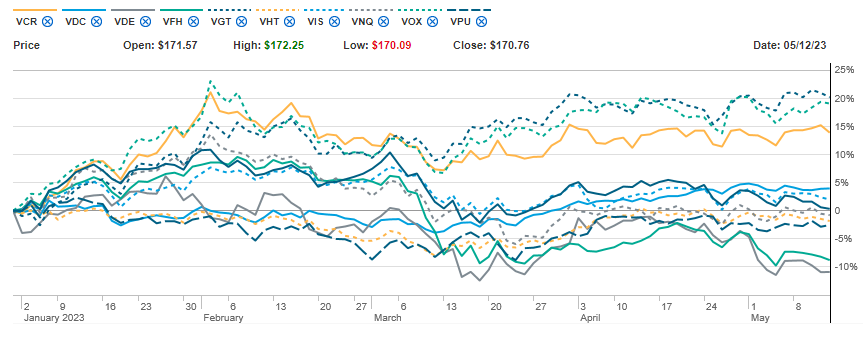
Year to date, technology and communication sectors and back to being the leaders. The S&P 500 index is taken
for a ride by the top 5 tech mega cap stocks. The market breadth is still weak.
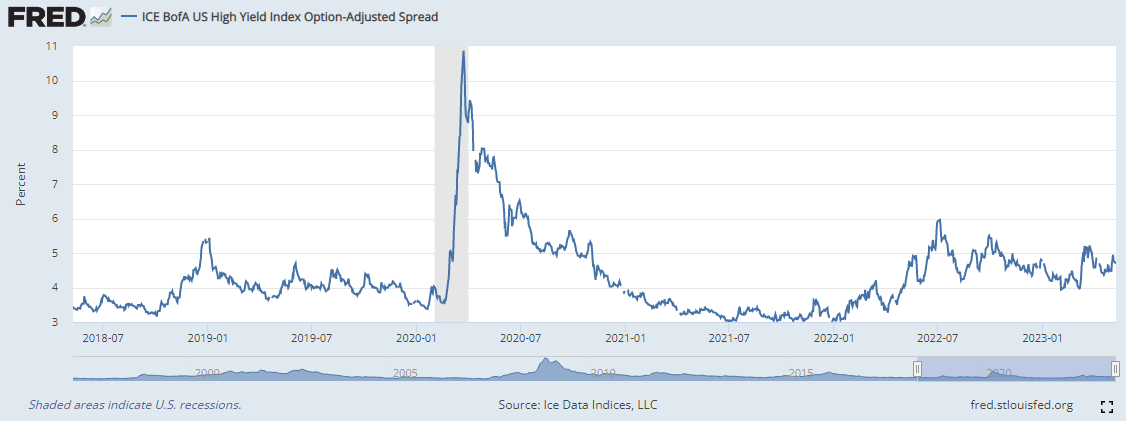
If the economy were to enter a recession, it is likely that some of the companies will struggle to keep up with
their debt payments causing their credit spread to widen. This indicator shows how the credit spreads have been
behaving so far.
The spreads have been very tame and no observation of spikes in spreads yet indicating a credit crunch.
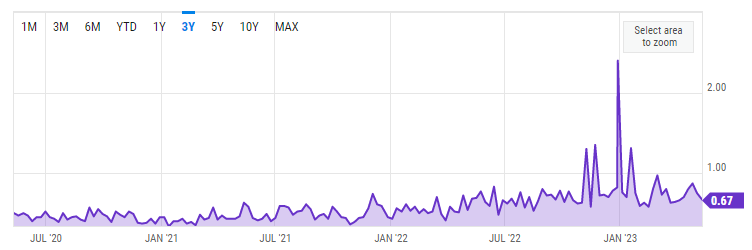
A spike in put / call ratio indicates that investors are very apprehensive about a sudden fall in the equity
markets. In April, the activity has been quite well behaved in the overall market (SPY) in spite of the turmoil
in the banking sector. Perhaps this looks too muted for the kind of news events in the horizon such as the debt
ceiling. We may be in for a surprise and volatility could pickup all of a sudden.
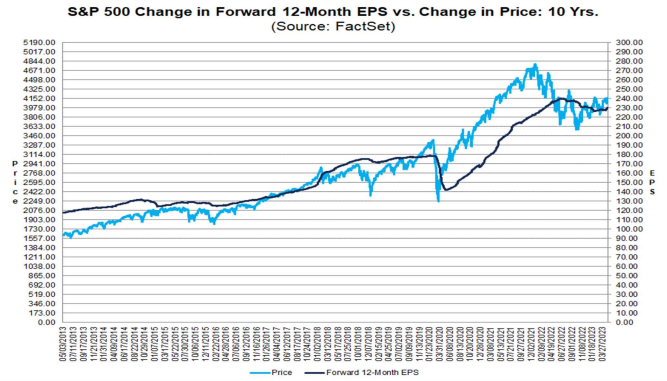
The current earnings forecast by equity analysts estimate the earnings potential for S&P 500 companies to be
around $230 which translates to a price to earnings ratio of 18 at the current S&P 500 price level. This
is just below the 5 year average and above the 10 year average.
It is likely that as inflation comes down, so will the earnings numbers. This indicates that the future S&P 500
price level could likely come down. Based on the companies that have reported so far,
the earnings have declined by -2.5%.
- Trillium Square Advisors LLC is a registered investment adviser offering advisory services in the state of North
Carolina and in other jurisdictions where exempted. Registration as an investment adviser does not imply a
certain level of skill or training, and the content of this communication has not been approved or verified by the
United States Security and Exchange Commission or by any state securities authority.
- Information presented is for educational purposes only and does not intend to make an offer or solicitation for
the sale or purchase of any specific securities, investments or investment strategies. Market data, articles and
other content in this presentation are based on generally available information and are believed to be reliable.
Trillium Square does not guarantee the accuracy of the information contained in this presentation. The
information is of a general nature and should not be construed as investment advice and relied upon in making
investment decisions.
- Investments involve risk and are never guaranteed. Be sure to first consult with a qualified financial adviser before
implementing any strategies discussed herein.
- Past performance is not indicative of future performance.
- The content of this communication and any accompanying documents are not to be copied,
excerpted or distributed without express written permission of the firm. Any other use beyond its author’s intent,
distribution or copying of the contents of this presentation is strictly prohibited. Nothing in this document is
intended to be legal, accounting, or tax advise, and is for informational purposes only.
- Hypothetical performance results have many inherent limitations. No representation is being made that any
account will or is likely to achieve profits or losses similar to those shown. In fact, there are frequently sharp
differences between hypothetical performance results and the actual results subsequently achieved by any
particular investment strategy. Hypothetical performance for illustration purposes only.
- Trillium Square will provide all prospective clients with a copy of our current Form ADV, Part 2A (Disclosure
Brochure) upon request. At anytime you can view our current Form ADV, Part 2A at https://adviserinfo.sec.gov
© Copyright Trillium Square Advisors LLC. All rights reserved.
Main Address:
Trillium Square Advisors LLC,
423 Peaslake Ct, Rolesville NC - 27571
Office Address:
Trillium Square Advisors LLC,
2840 Plaza Place, Suite 210, Raleigh, NC - 27612
Website Content
All written content on this site is for information purposes only. Opinions expressed herein are solely those of Trillium Square Advisors LLC unless otherwise specifically cited. Material presented is believed to be from reliable sources and no representations are made by our firm as to another parties’ informational accuracy or completeness. All information or ideas provided should be discussed in detail with an advisor, accountant or legal counsel prior to implementation.
This website may provide links to others for the convenience of our users. Our firm has no control over the accuracy or content of these other websites.
Registration Information
Advisory services are offered through Trillium Square Advisors LLC; an investment advisor firm domiciled in the State of North Carolina. The presence of this website on the Internet shall not be directly or indirectly interpreted as a solicitation of investment advisory services to persons of another jurisdiction unless otherwise permitted by statute.
Follow-up or individualized responses to consumers in a particular state by our firm in the rendering of personalized investment advice for compensation shall not be made without our first complying with jurisdiction requirements or pursuant to an applicable state exemption.
For information concerning the status or disciplinary history of a broker-dealer, investment advisor, or their representatives, a consumer should contact their state securities administrator.